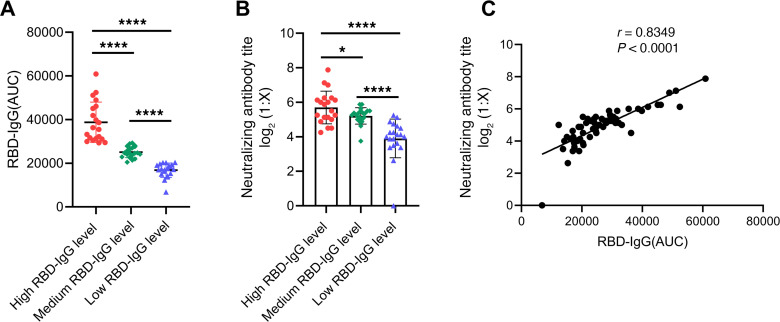
Figure 4. Analysis of correlation between RBD-IgG and neutralizing antibody titers.
(A) According to the normalized AUC values, a total of 60 serum samples were divided into 3 groups based on the RBD-IgG levels of high, medium, and low. (B) Neutralizing antibody titers by using the authentic SARS-CoV-2 were detected for serum samples indicated by (A). The P value between any 2 groups in (A) and (B) was calculated by Student–Newman–Keuls multiple comparisons test, ANOVA, ****P < 0.0001, ***P < 0.001, **P < 0.01, *P < 0.05. (C) Correlation analysis between normalized AUC values of RBD-IgG and neutralizing antibody titers in the 60 serum samples from (A and B). There was a strong correlation between neutralizing antibody titer and RBD-IgG (P < 0.0001, r = 0.8349). Pearson correlation coefficient was used to determine the r value of the correlation between the 2 groups.

