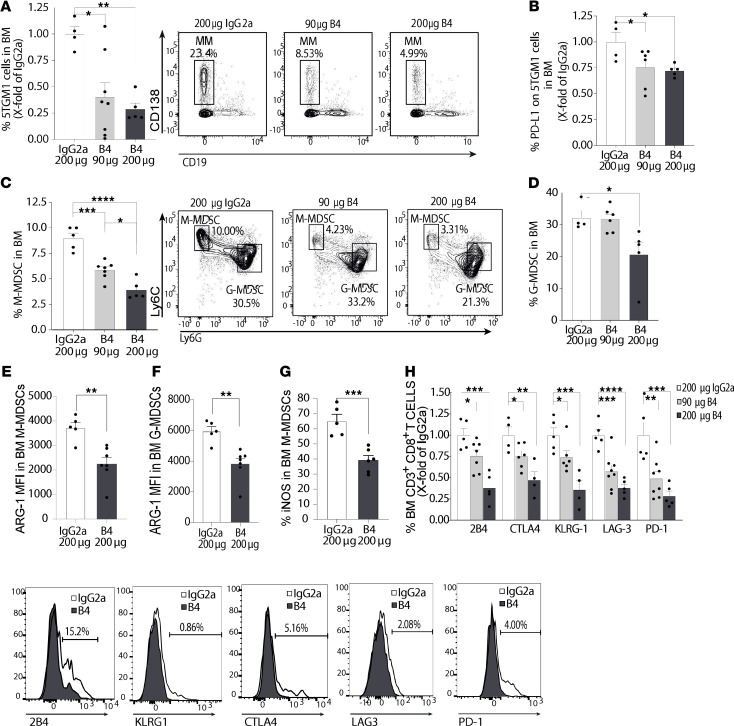
Figure 15. B4 reduces tumor load, MDSCs, and T cell suppression in a dose-dependent manner.
(A–H) C57BL/KaLwRij mice were injected with 1 × 10⁶ 5TGM1 cells. After 2 weeks, the mice were divided into 3 groups and treated with 5 injections of 90 or 200 μg of B4, or 200 μg IgG2a. (A) Percentage of 5TGM1 cells in the BM following 5 treatments. Representative dot plot shown (n = 4–7). (B) Percent of PD-L1 on 5TGM1 cells in the BM following 5 treatments (n = 4–6). (C) Percent of M-MDSCs in the BM following 5 injections. Representative dot plots are shown (n = 4-6). (D) Percent of G-MDSCs in the BM following 5 injections. Representative dot plot shown in C (n = 4–6). (E and F) Arginase-1 staining on BM M-MDSCs (E) and G-MDSCs (F) following 5 injections of 200 μg B4 or 200 μg IgG2a (n = 5–7, **P < 0.01). (G) iNOS staining on BM M-MDSCs following 5 injections of 200 μg B4 or 200 μg IgG2a (n = 5–7, ***P < 0.001). (H) BM-derived T cells analyzed for PD-1, LAG-3, CTLA-4, 2B4, and KLRG-1. Representative histograms are shown (n = 4–8). *P < 0.05, **P < 0.01, ***P < 0.001, ****P < 0.0001, with unpaired t test for pairwise comparisons and 1-way ANOVA with Holm-Sidak multiple corrections test for 3 groups.

