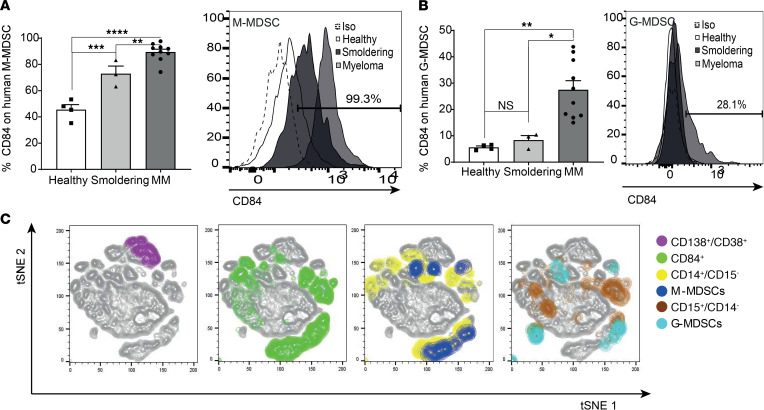
Figure 2. CD84 is expressed on MDSCs in the MM microenvironment.
(A) Human BM-derived (CD14+, CD11B+, CD15–, HLA-DR–) M-MDSCs. A representative plot, showing percentages CD84+ MM derived M-MDSCs, is shown (n = 3–8). (B) Human BM derived (CD15+, CD11B+, CD14–, HLA-DR–) G-MDSCs. A representative histogram, and plot showing percent G-MDSCs expressing CD84, is shown (n = 3–8). (C) t-SNE plots identifying CD14+ cells, M-MDSC, CD15+ cells, G-MDSCs, MM cells, and CD84 expression. Representative t-SNE plots based on CD14+, CD15+, M-MDSC, G-MDSC, MM, and CD84+ cells from the MM patient BM samples (t-SNE was run with perplexity of 30 with 1000 iterations; 800,000 live cells were randomly selected). The cells are colored according to the expression level of CD14+/CD15– for CD14; CD14+/CD15–/CD11b+/HLA-DRlo/– for M-MDSC; CD15+/CD14– for CD15; CD15+/CD14–/CD11b+/HLA-DRlo/– for G-MDSC; and CD138+/CD38+ for MM cells and CD84 markers. *P < 0.05, **P < 0.01, ***P < 0.001, ****P < 0.0001, with either unpaired 2-tailed t test for pairwise comparisons or 1-way ANOVA with Holm-Sidak multiple corrections test for 3 groups.

