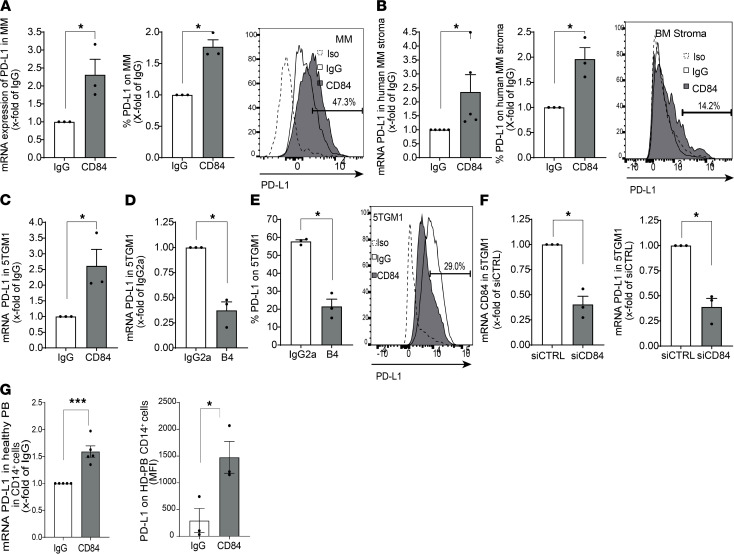
Figure 3. CD84 upregulates PD-L1 expression in MM cells and their microenvironment.
(A) Sorted primary MM cells (for mRNA analysis) or total primary BM stained to identify MM cells (for protein analysis) from patients were stimulated with anti-CD84 activating or control antibodies. PD-L1 mRNA (left graph) or protein (right graph) were determined by qPCR or FACS analysis, respectively. A representative histogram, with percent of CD84+ cells, is shown. (B) BM aspirates from primary MM patients were seeded and grown until a confluent adherent layer was formed. Thereafter, CD84 was activated with anti-CD84 or control antibodies, and RNA (left graph) and protein (right graph) expression was analyzed using qPCR and flow cytometry, respectively. A representative histogram, demonstrating the percent of CD84+ cells, is shown (n = 3–5). (C) 5TGM1 cells were activated with anti-CD84 or control antibodies. PD-L1 message was analyzed by qPCR (n = 3). (D and E) 5TGM1 cells were incubated with antagonistic anti-CD84 B4 or control antibodies. PD-L1 mRNA (D) or protein (E) were analyzed by qPCR or flow cytometry, respectively. Representative histograms are shown (n = 3). (F) 5TGM1 cells were treated with either siCTRL or siCD84; RNA was purified and analyzed by qPCR for CD84 (left graph) and PD-L1 (right graph) mRNA levels (n = 3). (G) Primary PB CD14+ cells from healthy donors were treated with anti-CD84 activating antibody or control antibodies. PD-L1 mRNA (left graph) or protein (right graph) levels were analyzed by qPCR and flow cytometry, respectively (n = 3–5).

