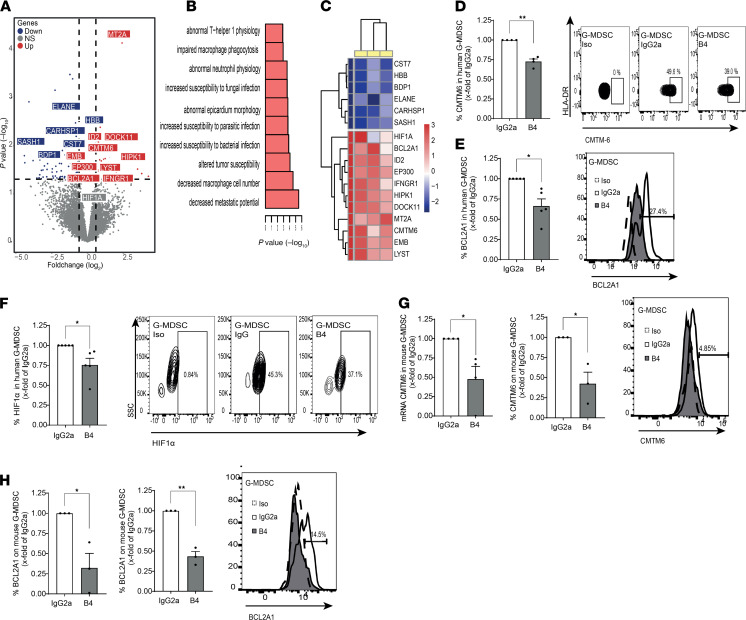
Figure 9. CD84 regulates functional and immunosuppressive pathways in human MM G-MDSCs.
(A–C) Sorted BM G-MDSCs (CD15+, CD14–, HLA-DR–, CD11B+) were activated with anti-CD84 or -IgG1k antibodies. After 24 hours, RNA was purified and sequenced using MARS-seq. (A) Volcano plot for G-MDSC genes, with gray indicating non-DE genes and with DE-expressed genes shown either in blue, for downregulated, or in red, for upregulated. (B) Highlighted GO terms from the upregulated DE genes of G-MDSCs (MGI Mammalian Phenotype, EnrichR). (C) Heatmap depicting highlighted genes from the DE genes, with log2 CD84 activated to IgG control ratio values shown for each patient (n = 3). (D–F) Primary MM BM aspirates were treated with B4 or IgG2a antibodies. After 48 hours, G-MDSCs were analyzed for CMTM6 (n = 4) (D), BCL2A1 (n = 5) (E), and HIF1α (F) protein levels. Representative plots are shown. (G and H) Primary murine sorted G-MDSC from 5TGM1-injected mice were blocked with B4 or IgG2a antibodies. RNA was purified after 24 hours, and cells were analyzed for CMTM6 (G) and BCL2A1 (H) message and protein expression. Representative histograms are shown (n = 3-4). *P < 0.05, **P < 0.01, with paired t test for pairwise comparisons. One-tailed Student’s t test was used for G and H.

