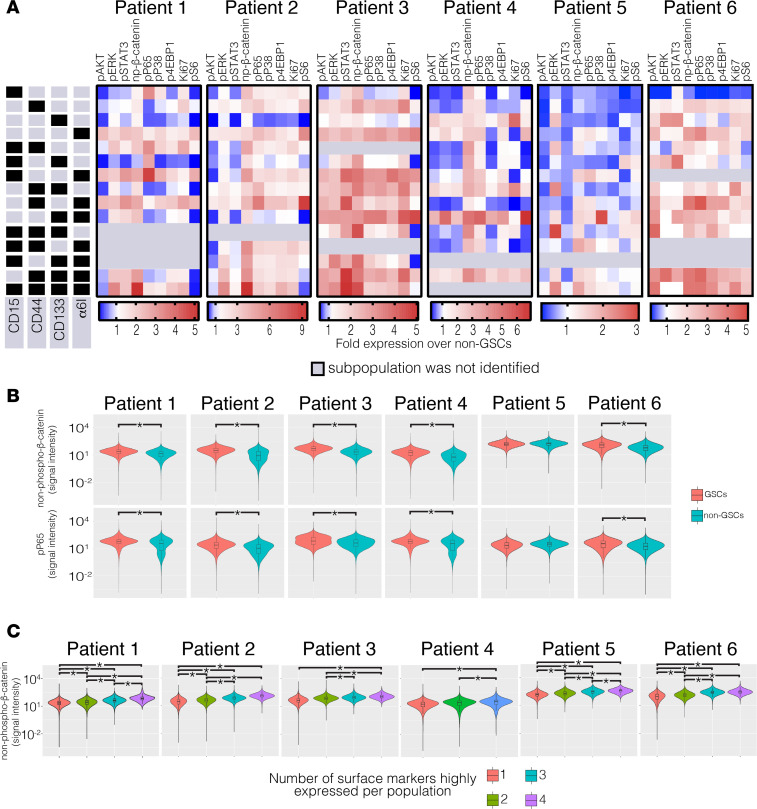
Figure 3. GSC subpopulations have differential activation of MEK/ERK, WNT, AKT, and NF-κB pathways.
(A) Side panels indicate the expression level (high, black; low, gray) of the cell-surface markers that define each subpopulation. Across each patient, the indicated protein in each subpopulation is shown; heatmaps indicate fold protein expression relative to non-GSCs. Six intracellular pathways (pAKT, pERK, pSTAT3, non–phospho-β-catenin, pP65, and pP38) and three intracellular downstream effectors (Ki-67, p4E-BP1, and pS6) were examined. (B) Expression of non–phospho-β-catenin and pP65 in GSCs and non-GSCs, on log scale. Kruskal-Wallis with Mann-Whitney U post hoc tests were used, *P < 0.05 vs. non-GSCs. (C) Expression of non–phospho-β-catenin in GSCs grouped by the number of highly expressed surface markers, on log scale. Kruskal-Wallis with Bonferroni’s post hoc tests were used; *P < 0.05. GSC, glioblastoma stem cell.

