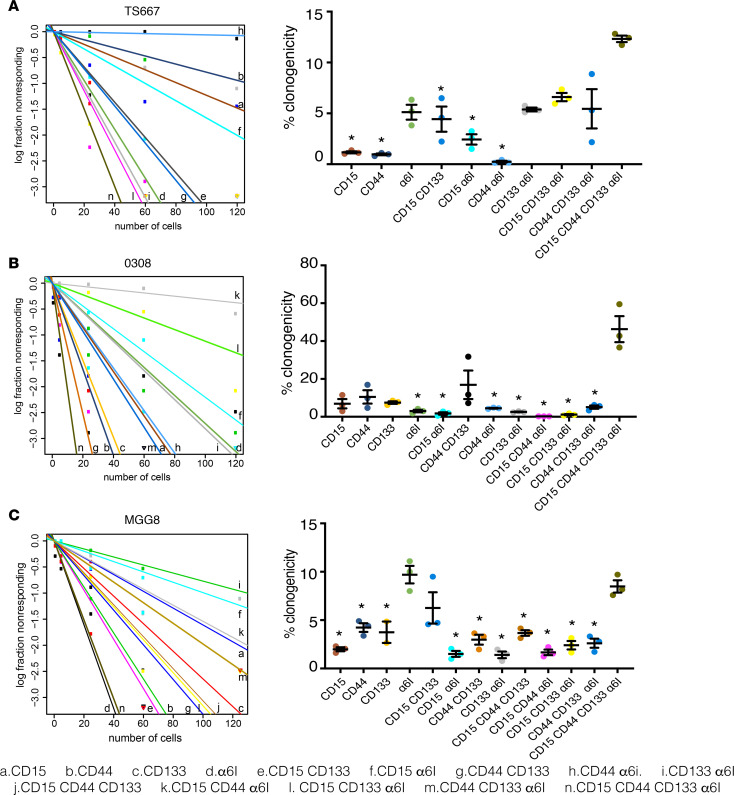
Figure 5. GSC subpopulations vary in their self-renewal potential.
Frequency of clonogenic cells was assessed by extreme limiting dilution analysis using GSC subpopulations derived from (A) TS667, (B) 0308, and (C) MGG8 lines (120, 60, 24, 5, and 1 cells per well; 12–18 replicates per dilution). The experiment was repeated 3 times, and results are shown as mean ± SEM. ANOVA with Tukey’s post hoc tests were used to assess the significance of differences between each GSC subpopulation; *P < 0.05 vs. quadruple-high. GSC, glioblastoma stem cell.

