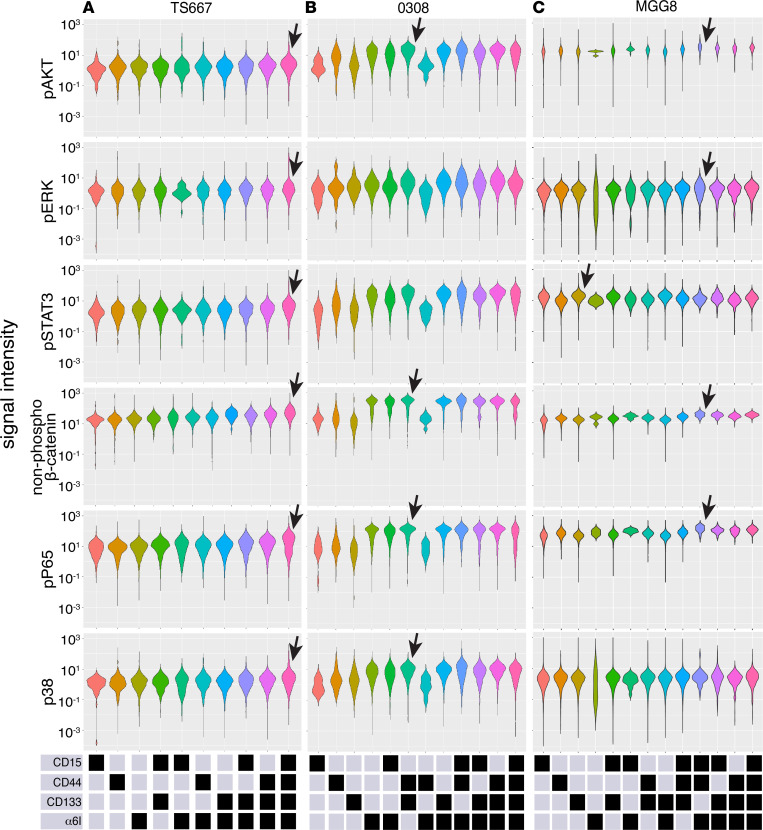
Figure 6. Mass cytometry detects core signaling within single cells among 13 GSC subpopulations from 3 patient-derived lines in long-term culture.
Violin plots indicate protein levels for 6 intracellular pathways (pAKT, pERK, pSTAT3, non–phospho-β-catenin, pP65, and pP38) in (A) TS667, (B) 0308, and (C) MGG8 cells. Bottom panels show the levels (high, black; low, gray) of the cell-surface markers defining each subpopulation. Arrows highlight the subpopulation with the highest average protein abundance, as discussed in the text. GSC, glioblastoma stem cell.

