Figure 4.
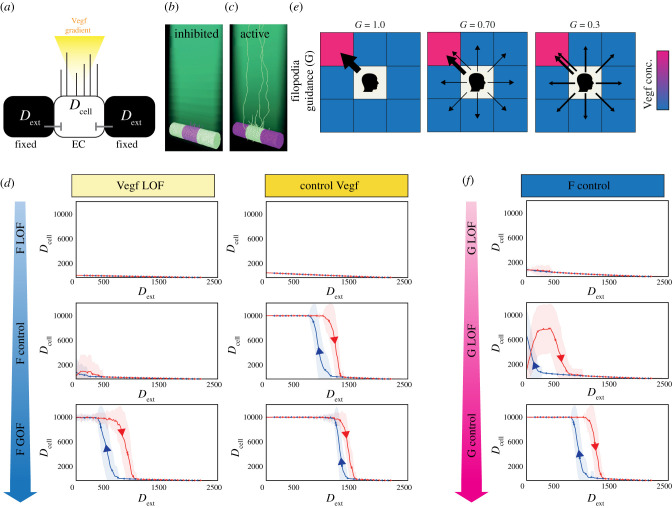
Filopodia movement in Vegf gradients confers bistable properties to Notch patterning. (a) Schematic of the MemAgent-Spring Model Hysteresis (MSM-Hyst) testbed, designed to probe the behaviour of the single endothelial cell in the middle (through Dcell dynamics) in response to externally driven inhibitory Dext signals from two neighbouring pseudo-cells and VEGF in the environment. (b,c) Screenshots of the MSM-Hyst simulation testbed when Dext is at max (b) and min (c) levels. In (b) the central cell is inhibited, in (c) the central cell is uninhibited so has high Dll4 and filopodia (tip cell selected). Dll4 high cells, light green; Dll4 low cells. purple; VEGF gradient in the environment, dark green. Note the peripheral pseudo-cells do not have filopodia, as they only provide Dext, they do not respond to Vegf or Notch themselves, in this highly constrained testbed. (d) Dcell dynamics as a function of Dext in cases where we covary the model parameters determining the steepness of the Vegf gradient (0.02 (LOF), 0.04 (control)), and the responsiveness (in terms of probability to extend) of the filopodia to sensed Vegf (F = 0.5 (LOF), 2 (control), 3 (GOF)). We can see that some parameter settings (e.g. F = 2, Vegf gradient = 0.04) yield bistable dynamics with hysteresis, while others (e.g. F = 2, Vegf gradient = 0.02) do not. N = 100. Shading indicates 1 standard deviation. (e) A cartoon demonstrating how the filopodia guidance parameter (G) would influence the behaviour of a growing filopodium in a two-dimensional schematic (the MSM simulation extends this to three dimensions). The central square represents the memAgent at the head of the filopodium, who must decide which direction to step every time step that the filopodium extends (see Methods for full details). G determines the probability that the memAgent will choose the adjacent square with the highest level of Vegf (Vegf high, pink; Vegf low, blue). Thickness of the arrows represents the probability of stepping into a given square. When G = 1 (left panel), there is a 100% probability of stepping into the pinkest square. As G is decreased, the probability of stepping into a square at random increases—represented by uniformly distributed arrows and a thinner arrow pointing to the pinkest square. Note that the probability of stepping into the pinkest square is never zero, as stepping at random might still land on it. (f) Dcell dynamics as a function of Dext where we vary the guidance parameter G. As G approaches 0, the hysteresis window shrinks and the bistable dynamics disappear. For all plots, N = 100, shading indicates 1 standard deviation. F = 2 and V = 0.04 (both control settings). (Online version in colour.)

