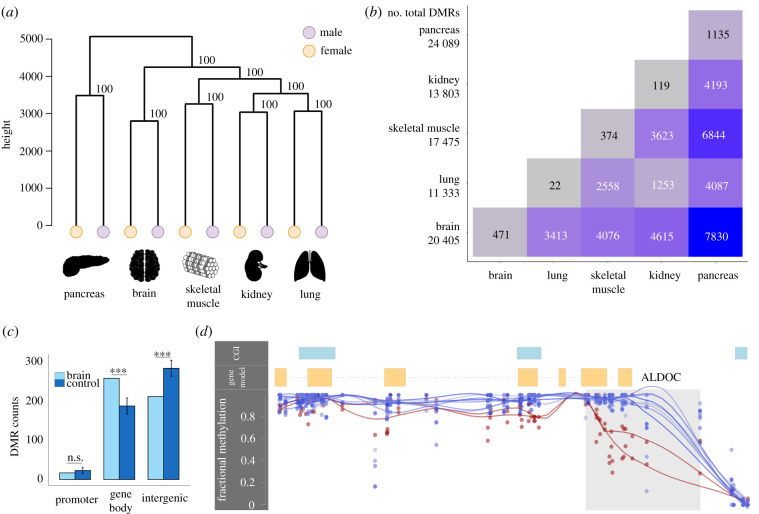
Figure 1.
Overview of DNA methylation patterns across the koala genome. (a) Hierarchical clustering of DNA methylation of five tissues. (b) Tissue-specific and shared differentially methylation regions (DMRs) between tissues. Total DMRs per tissue are reported in the first column. (c) Enrichment of brain DMRs in different functional regions compared to length and GC-matched control regions (***p < 0.0001, n.s., not significant, from 10 000 bootstraps). Error bars depict standard deviation. Results for other tissues are in electronic supplementary material, figure S1. (d) A 945 bp brain-specific DMR overlapping ALDOC's promoter and part of the gene body (shaded region) with corresponding CpG fractional methylation for the brain (lower lines) and eight remaining tissues (top lines). Line smoothing performed using local regression (LOESS). This gene was upregulated in the brain compared to the kidney (probability of differential expression greater than 96% from NOISeq).

