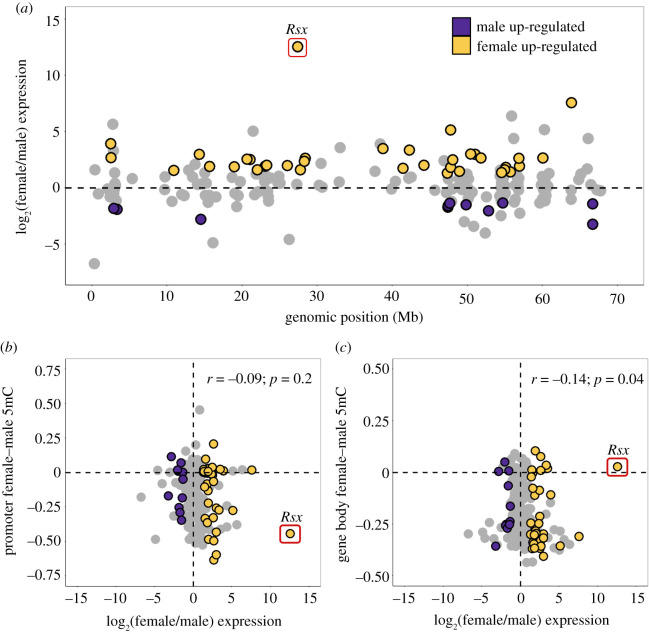
Figure 3.
Female and male gene expression across autosomes and the X chromosome using kidney RNA-seq data. (a) Distribution of female (yellow) and male (purple) upregulated genes by NOISeq (probability of differential expression greater than 95%) across the X chromosome (scaffolds ordered by scaffold length). (b,c) The mean female and male fractional methylation difference across each gene promoter (b) and gene body (c) correlated with the corresponding log-transformed ratio of female to male expression. Spearman's rank correlation coefficient and the associated p-value are reported. The Rsx gene was excluded from the correlation calculation.

