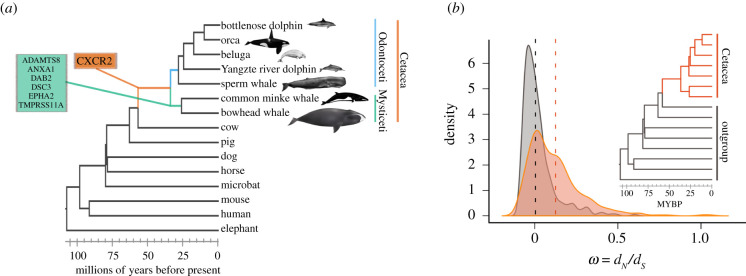
Figure 2.
Codon-based models of evolution (ω = dN/dS models). (a) TSGs with the signature of positive selection in different branches of the cetacean tree of life. (b) For the branch model, we found that the distribution of the ω values estimated between groups is significantly different (D = 0.32764, p-value < 2.2 × 10⁻⁶). The height of the curves is relative to the number of genes with the observed ω values and the dotted lines represent the mean value for cetaceans (orange) and the outgroup (grey). (Online version in colour.)

