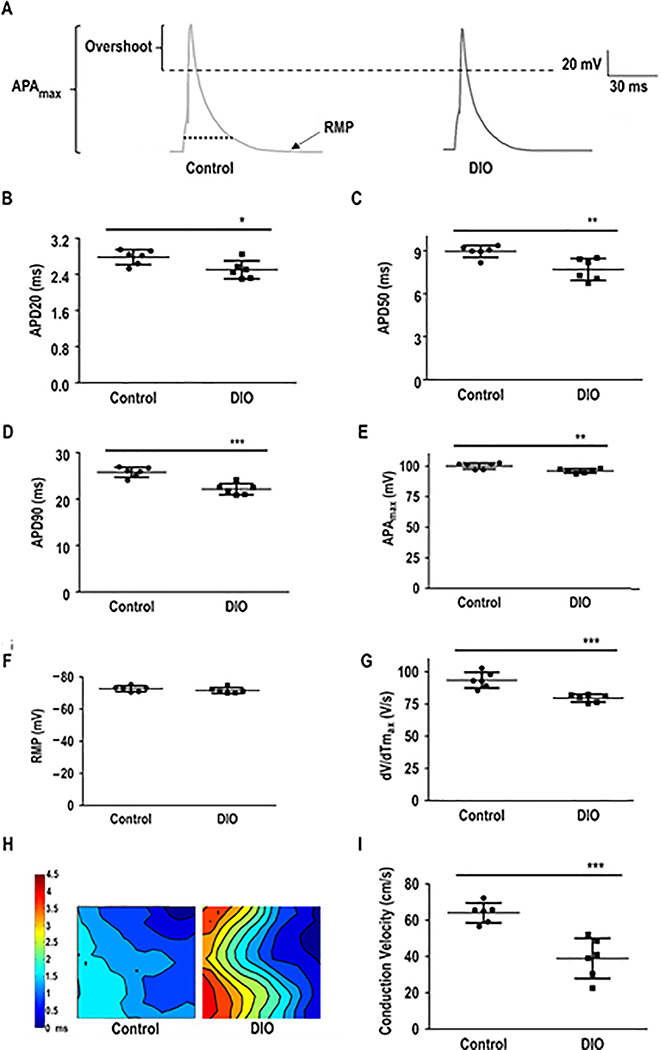
Figure 2:
Atrial action potential duration (APD) is altered in DIO mice. Patch-clamped atrial myocytes displayed reduced APD, a condition associated with AF induction. A: Representative AP tracings in atrial myocytes in DIO and control mice. Measured parameters include: B: APD at 20% repolarization (APD20; n=6 cells); C: APD at 50% repolarization (APD50; n=6 cells); D: APD at 90% repolarization (APD90; n=6 cells). E: Maximum AP amplitude (APAmax; n=6 cells). F: Resting membrane potential (RMP; n=6 cells). G: Instantaneous rate of voltage change over time (dV/dTmax), an indicator of atrial conduction velocity (CV; n=6 cells). H: Representative images of atrial optical mapping experiments in DIO and control mice. I: Quantification of mean atrial CV with optical mapping (N=6 hearts). *P<0.05, **P<0.01; ***P < 0.001, ****P< 0.0001.

