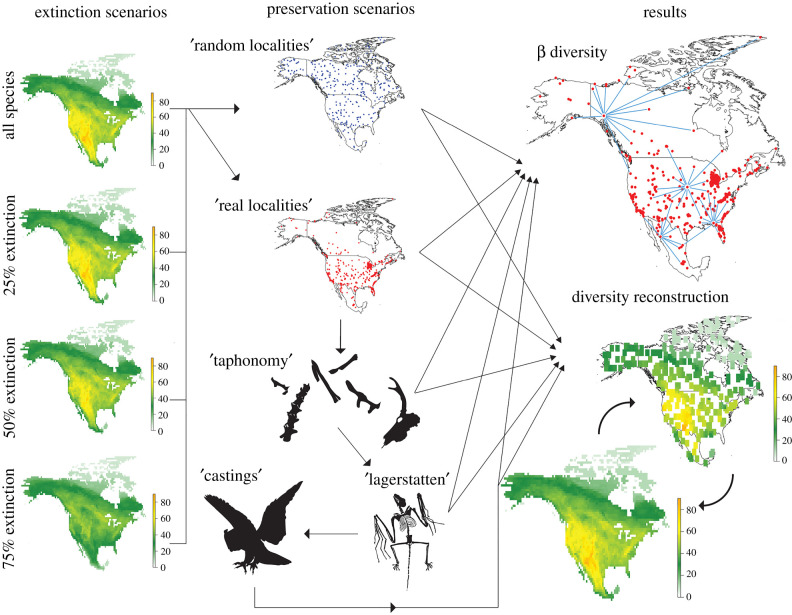
Figure 1.
Flow chart illustrating the methods employed for reconstructing changes in the spatial organization of biota with increasing extinction intensity. (Left) Mammalian species richness is first mapped onto 1° grid cells for 0, 25%, 50%, and 75% extinction scenarios. (Centre) In each scenario 3, 30, and 300 ‘localities’ are iteratively simulated; in our first experiments (random) these are placed randomly, while from our second experiment (localities) onwards, these are chosen from existing Rancholabrean fossil sites (shown here). Species lists compiled from simulated sites are then passed through a stepped series of taphonomic filters (taphonomy, lagerstätten, and castings). (Right) In each iteration, final species lists are then used to calculate beta diversity as a function of multisite Sørensen's index, and also used to map diversity back onto continental North America (here using a 3 × 3 grid moving window interpolate richness across empty grid cells). These simulated beta diversity and richness patterns are compared back to original extinction scenarios, to see how accurately biogeographic changes associated with extinction are recorded in simulations. (Online version in colour.)

