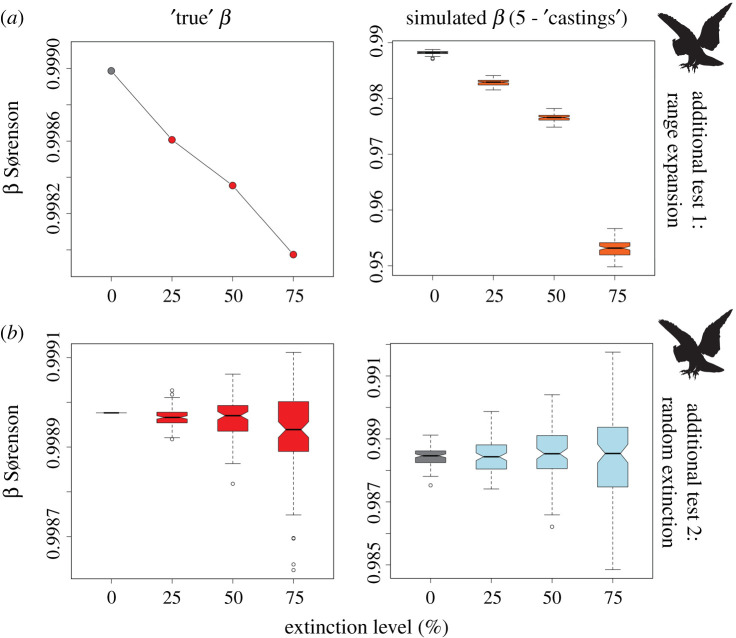
Figure 4.
Simulated beta diversity for our two additional ‘castings’ experiments (performed using 300 sites); left column gives ‘true’ beta patterns with increasing extinction intensity (i.e. equivalent to plots shown in figure 2a), while the right column illustrates beta patterns generated in simulations. (a) Extinction of small-ranged species combined with range expansion of 5%, 10%, and 20% of the largest-ranged surviving species (for 25%, 50%, and 75% extinction thresholds, respectively). (b) Null scenario, where extinction is random with respect to range size. Baseline (i.e. 0% extinction) scenario illustrated in grey. Boxplots coloured blue indicate those that overlap with the baseline and thus are unlikely to be detectable in the fossil record; those coloured orange possess no overlap with the baseline, and thus indicate scenarios where change in beta diversity is most likely detectable. Boxes give the interquartile range (IQR), while whiskers give 1.5x IQR, and outliers plotted as points. (Online version in colour.)

