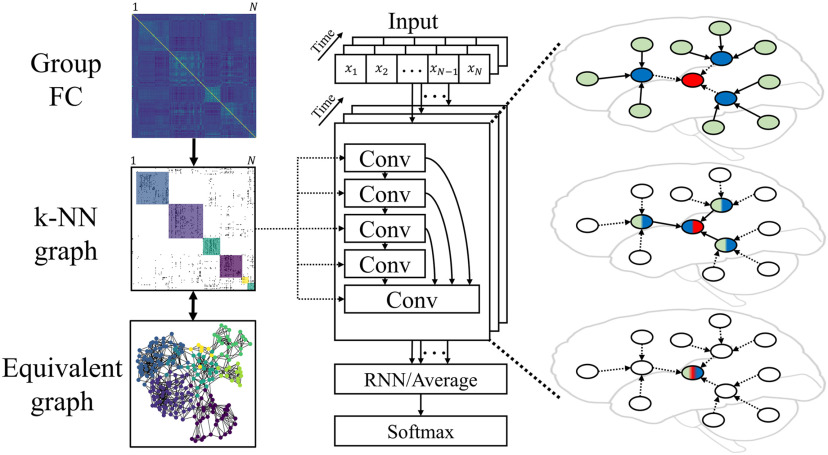
Figure 1. .
Overview of cGCN. On the left, the graph definition for cGCN was based on the group FC from all training data, which can be further simplified as a k-nearest neighbors (k-NN) graph with binarized edges. In the middle, the cGCN architecture consisted of 5 convolutional layers. The convolutional neighborhood was defined by the shared k-NN graph across convolutional layers, time frames, and subjects. The recurrent neural network (RNN) layer (or the temporal average pooling layer) obtained latent representations from all frames. The final classification was achieved by the Softmax layer. On the right, an intuitive illustration of the spatial graph convolution showed the information aggregation between neighboring nodes.

