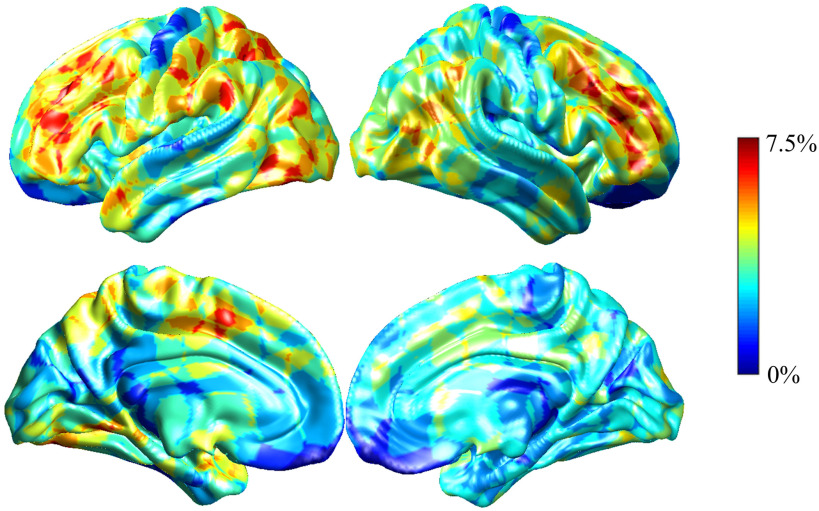
Figure 6. .
Visualization of the performance degradation through the single-ROI occlusion for the ASD classification. We averaged performance drop on all models used in the leave-one-site-out cross-validation. The maximum performance drop was 7.5% when k = 3, and the smallest performance drop was 6.0% when k = 20. The color of the region reflected the performance degradation if corresponding ROI was occluded. The salient regions related to the ASD classification included frontoparietal network, default mode network, and ventral attention network.

