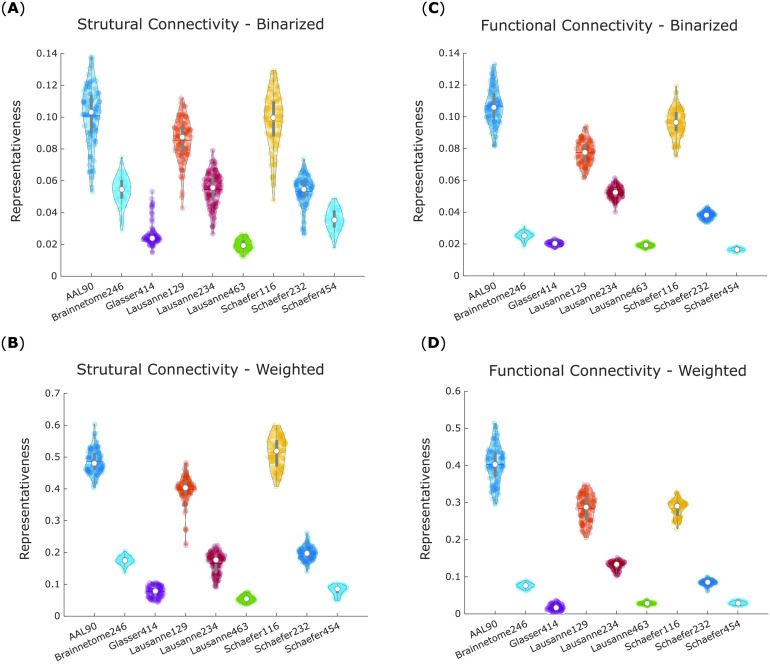
Figure 5. .
Regular-random representativeness inversely scales with parcellation size for both structural and functional networks. For each parcellation, violin plots show the distribution of network representativeness between regular and random networks (1 minus regular-random portrait divergence) obtained from it, for each of the 100 HCP subjects. (A) Binary networks from structural connectivity. (B) Weighted networks from structural connectivity. (C) Binary networks from functional connectivity. (D) Weighted networks from functional connectivity. White circle, mean; center line, median; box limits, upper and lower quartiles; whiskers, 1.5× interquartile range.

