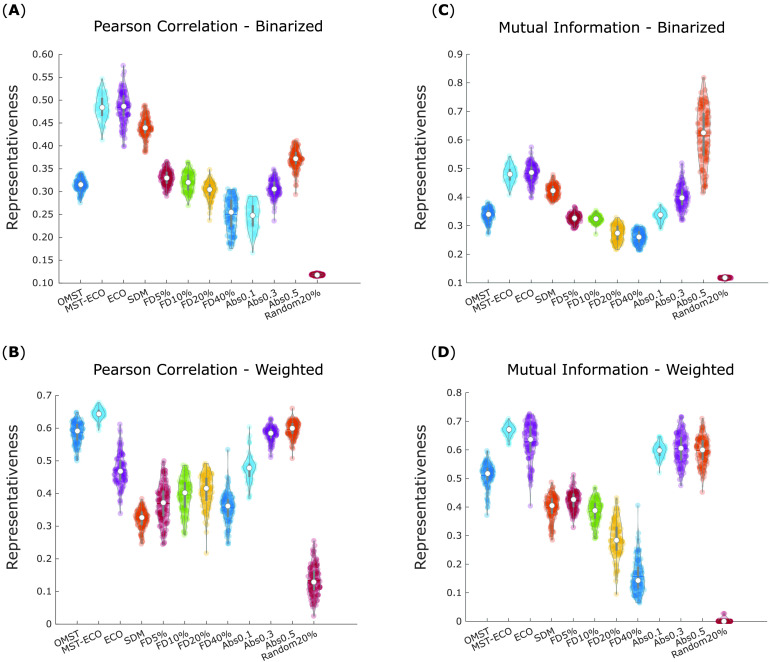
Figure 9. .
Representativeness of filtering schemes. For each filtering scheme, violin plots show the distribution of cross-parcellation representativeness for 100 HCP subjects. Each data point corresponds to the average representativeness of a given filtering scheme across parcellations (1 minus average portrait divergence between functional networks obtained from applying the same filtering scheme across all nine parcellations). (A) Binary networks based on Pearson correlation between BOLD signal time series. (B) Weighted networks based on Pearson correlation between BOLD signal time series. (C) Binary networks based on mutual information between BOLD signal time series. (D) Weighted networks based on mutual information between BOLD signal time series. White circle, mean; center line, median; box limits, upper and lower quartiles; whiskers, 1.5× interquartile range. OMST, orthogonal minimum spanning trees. ECO, efficiency cost optimization. SDM, structural density matching. FD, fixed density. Abs, absolute thresholding. Random 20% corresponds to preserving 20% of connections, chosen at random.

