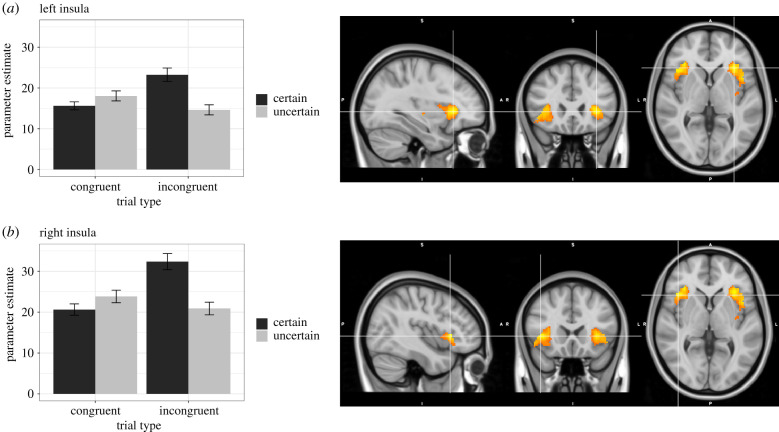
Figure 3.
BOLD activation in bilateral insula in response to the interaction of uncertainty and incongruence. Images are centred on peak voxel for each cluster from the ROI analysis: (a) left insula (MNI coordinates: X = −32, Y = 24, Z = 2) and (b) right insula (MNI coordinates: X = 42, Y = 20, Z = 2). Plots represent mean parameter estimates for each of the four trial types (certain congruent, uncertain congruent, certain incongruent, uncertain incongruent), extracted from functional cluster masks and separated by cluster. Error bars on the bar graphs represent within-subject standard errors.

