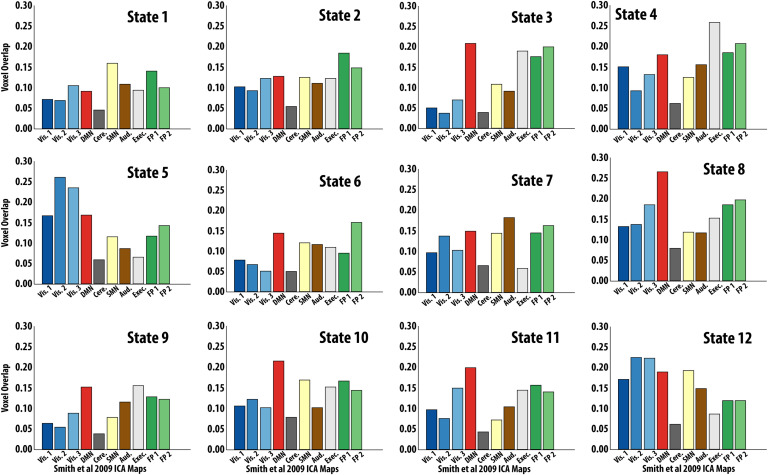
Figure 5. .
Hidden Markov Model (HMM) State Activation Map Overlap with Resting-State Networks Voxel overlap proportion for each HMM-derived state to the 10 resting-state independent component analysis (ICA) maps from (Smith et al., 2009). Ordering of states matches that of Figure 3. Specifically, states 1 and 2 clustered together in one metastate, states 3–11 in another metastate, and state 12 clustered alone.

