Abstract
Imaging of cellular electric potential via calcium-ion sensitive contrast agents is a useful tool, but current it lacks sufficient depth penetration. We explore contrast-enhanced photoacoustic (PA) imaging, using Arsenazo III dye, to visualize cardiac myocyte depolarization in vitro. Phantom results show strong linearity of PA signal with dye concentration (R2 > 0.95), and agree spectrally with extinction measurements with varying calcium concentration. Cell studies indicate a significant (> 100-fold) increase in PA signal for dye-treated cells, as well as a 10-fold increase in peak-to-peak variation during a 30-second window. This suggests contrast-enhanced PA imaging may have sufficient sensitivity and specificity for depth-resolved visualization of tissue depolarization in real-time.
PACS codes: (87.85.Pq) Biomedical imaging, (78.20.Pa) Photoacoustic effects, (87.19.Hh) Cardiac dynamic, (87.85.jc) Electrical, thermal, mechanical properties of biological matter, (87.16.dj) Dynamics and fluctuations
1. Introduction
Calcium-ion (Ca2+) exchange mediates a wide range of mammalian cellular functions, such as muscle contraction, cell signaling, cell secretion, glycolysis, cell division and growth[1]. In neuronal and cardiac cells, Ca2+ exchange is essential for electrophysiological activity[2], as well as being responsible for mammalian myocyte inter-cell electro-mechanical coupling. During cardiac myocyte depolarization, cytosolic Ca2+ concentration has been shown to rapidly increase by a factor of 10 or greater[3]. Cardiomyocytes can sustain these high concentrations for hundreds of milliseconds[3]. As such, visualization of Ca2+ exchange is a useful tool in the study of cardiac physiology, for evaluating cellular dysfunction, and in assessing the efficacy of medical interventions.
Optical imaging – one of the most common methods utilized to assess Ca2+ transport – offers high spatio-temporal resolution and a large palette of Ca2+-sensitive fluorescent dyes[4]. However, these methods may require clearance of blood from tissue, and often can only be performed ex vivo[4,5]. Additionally, due to the reliance on fluorescent emission, observation of electrical activity is often limited to the tissue surface[4]. Such methods are unable to capture the full three-dimensional (3D) nature of tissue electrical propagation, which is known to play a role in cardiac arrhythmia disorders[6]. The availability of an imaging technique that can visualize electrical propagation throughout a 3D tissue, with high spatio-temporal resolution and high penetration depth, could offer improved insight into electrophysiological dysfunction and the mechanisms of medical interventions.
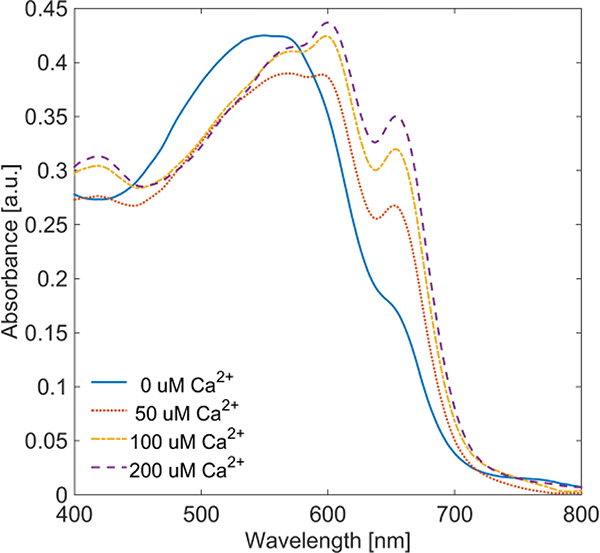
Arsenazo III (Asz) is a Ca2+ chelating dye[7], which also exhibits a shift in absorbance dependent upon both dye concentration and pH[8]. In the presence of dissolved Ca2+, Asz exhibits absorption peaks at 600 nm and 655 nm, the prominence of which depends on the ratio of Ca2+ to Asz (Figure 1). At 575 nm, Asz shows minor variation (< 10%) in absorbance relative to Ca2+ concentration, indicating 575 nm can be considered an isosbestic point. Asz has been suggested as a PA contrast agent for observation of Ca2+ concentration changes[9], but PA imaging results have yet to be obtained using electrophysiologically active cells or tissues.
Fig. 1.
Optical extinction of 50 μM Asz dye in buffered saline with varied Ca2+ concentration.
Photoacoustic (PA) imaging relies on optical excitation of endogengous or exogenous chromophores, followed by an ultrasonic detection of the resulting acoustic wave [10]. Specifically, PA signal is generated by chromophores in the tissue which absorb photons emitted by a pulsed light source. When the pulse duration of the light source is sufficiently short, the absorbed energy results in rapid thermoelastic expansion of the chromophore, which generates an acoustic wave that can be detected using traditional ultrasonic systems[10]. As such, local PA signal (p0) is proportional to the absorbed energy, which is a product of local optical absorption (μa) and local fluence (F), both of which are a function of wavelength (λ). PA signal is also proportional to the tissue thermal properties, known as the Grüneisen parameter (Γ) – a function of temperature (T). Combined they result in the photoacoustic equation, shown below:
| (1) |
The reliance of PA methods on optical absorption make it well suited to monitor absorption-based contrast. For that reason, we investigated PA imaging using Arsenazo III (Asz), a Ca2+ sensitive dye[7], to determine the potential for PA based visualization of cytosolic Ca2+ concentration changes resulting from cellular depolarization.
2. Methods
2.1. Arsenazo III dye preparation
Asz dye (Sigma-Aldrich Inc., St. Louis, MO, USA) was dissolved in stock HEPES buffered normal saline (Sigma-Aldrich Inc., St. Louis, MO, USA). Asz solutions were titrated with NaOH and HCl to a pH of 7.4. Ca2+ solution was obtained by dissolving CaCl2 (Sigma-Aldrich Inc., St. Louis, MO, USA) into the stock buffered saline solution. Ca2+ solution was then added to Asz solution, in varying amounts, to generate different Ca2+ to Asz ratios for extinction measurements and for later PA measurements. Optical extinction measurements were made using a spectrophotometer (UV-3600, Shimadzu Corp., Kyoto, Japan).
2.2. Phantom imaging studies
Initial studies were conducted on phantom imaging targets containing buffered Asz-Ca2+ solutions to examine PA signal response with respect to varying Asz and Ca2+ concentrations. Asz solution was enclosed in a glass Pasteur pipette and submerged into degassed water. A 1.5 MHz immersion ultrasound transducer (E1259, Valpey-Fisher, Inc., Hopkinton, MA, USA, 1.5-inch diameter, 1.7-inch spherical focus) was used to receive acoustic signal. The PA signals acquired by the transducer were amplified by an ultrasound pulser/receiver amplifier (5073PR, Olympus NDT Inc., Waltham, MA, USA, gain of 39 dB) in receive mode and digitized using an oscilloscope (CompuScope 12400, Gage Applied Technologies Inc., Lockport, IL, USA) operating at 200 MHz sampling frequency. PA laser excitation was provided by a Q-switched pulsed Nd:YAG laser (Quanta-Ray PRO-290, Spectra-Physics Lasers, Mountain View, CA, USA) pumping a tunable optical parametric oscillator (Spectra-Physics premiScan/MB, GWU-Lasertechnik Vertriebsges, Germany) to select wavelength. The laser pulse-duration was 5–7 ns, with a pulse repetition rate of 10 Hz and energy varied from approximately 10 mJ – 20 mJ per pulse for the wavelengths used.
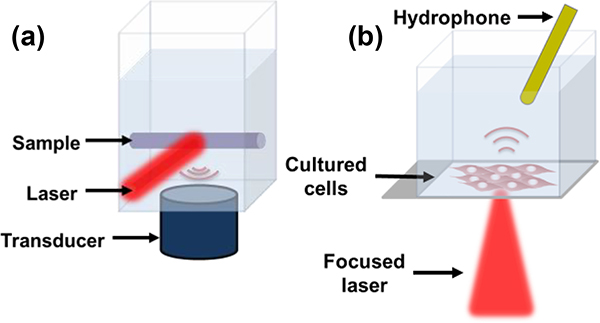
Samples were irradiated at the isosbestic point (575 nm) and at the two Ca2+ dependent absorption peaks (600 nm and 655 nm). Laser spot size was approximately one cm diameter and light was delivered via air beam. Approximately 5% of laser light energy was redirected and measured with a pyroelectric power meter (Nova II, Ophir Ltd., Jerusalem, Israel) to account for pulse-to-pulse and wavelength dependent energy variation. LabVIEW software (National Instruments, Inc., Austin, TX, USA) was used to integrate components and control data acquisition. This configuration allowed for consistent optical illumination and energy normalization. A diagram of the imaging setup is depicted in Figure 2.a.
Fig. 2.
Diagram of phantom imaging setup with air-beam laser irradiation and immersion transducer (a). Modified cell-study setup with focused laser and hydrophone (b).
Multiple samples were made by varying Asz dye concentration from 0 μM to 500 μM, as well as well as using a 500 μM Asz solution and varying the molar ratio of Ca2+ to Asz from 0 to 4. The Asz molar concentration used for PA experiments was 10-fold higher than that used in the UV-Vis extinction curves to achieve a high PA signal. Each sample was injected into the Pasteure pipette and measurements of PA signal amplitude (RF-line) were taken using the system described above, with 300 averages per sample.
2.3. HL-1 culture
HL-1 cardiac myocytes (provided by Dr. William Claycomb, Lousiana State University Health Science Center, New Orleans, LA, USA), which are phenotypically similar to mature cardiomyocytes and exhibit spontaneous depolarization[11], were used as an in vitro cellular imaging target. HL-1 cells passages 60–80 were maintained in Claycomb medium (Sigma-Aldrich Inc., St. Louis, MO, USA) with 10% fetal bovine serum (Sigma-Aldrich Inc., St. Louis, MO, USA, Lot# 12J001), 1% Penicillin/Streptomycin (Invitrogen), 1% Glutamax (Invitrogen), and 0.1 mM Norepinephrine (Sigma-Aldrich Inc., St. Louis, MO, USA). Cells were subcultured (1:3) every 4 days[12]. 12 hours before imaging, HL-1 cells were seeded at 80,000 cells/cm2 in Nunc™ Lab-Tek™ II CC2™ two chamber slides (Thermo Fisher Scientific, Inc., Waltham, MA, USA). Just prior to imaging, cells were rinsed three times and incubated for 20 minutes in Tyrode’s solution[13] containing 0.1 mM Norepinephrine, 200 μM Asz and 10 μM DMSO (Sigma-Aldrich Inc., St. Louis, MO, USA, to improve cellular uptake of Asz). Cells were then thrice rinsed with Tyrode’s solution containing Norepinephrine and immediately imaged using either optical or photoacoustic imaging.
2.4. Optical and fluorescent live-cell imaging
In order to optically verify cellular uptake of Asz and observe Asz binding/unbinding of cytosolic Ca2+, HL-1 cells were treated with Asz and imaged using bright field microscopy (EVOS FL, Thermo Fisher Scientific Inc., Waltham, MA, USA) with a rhodamine cube filter (AMEP4652, Thermo Fisher Scientific Inc., Waltham, MA, USA, emission 593 nm /40 nm FWHM). This setup was able to observe changes in the transmitted light intensity as cytosolic Asz chelates Ca2+ during cellular depolarization (Video S1). Additionally, to independently verify HL-1 myocyte cytosolic Ca2+ dynamics, cells were incubated with a fluo-4 AM calcium assay kit (F36206, Thermo Fisher Scientific Inc., Waltham, MA, USA) per manufacturer’s instructions and imaged with fluorescent microscopy using a green fluorescent protein (GFP) cube filter (AMEP4651, Thermo Fisher Scientific Inc., Waltham, MA, USA, emission 525 nm /50 nm FWHM) to verify cellular depolarization (Video S2).
To assess Asz cytoxicity, HL-1 cells were treated with Asz and rinsed,as described above, and immediately incubated using LIVE/DEAD® cell viability assay kit (L3224, Thermo Fisher Scientific Inc., Waltham, MA, USA) containing calcein-AM and ethidium homodimer-1 (EthD). Cells were incubated for 20 minutes in PBS with 1 μM green-fluorescent calcein-AM to indicate intracellular esterase activity and 2 μM red-fluorescent EthD to indicate a compromised plasma membrane. For comparison one plate of cells was incubated in PBS with 10 μM DMSO prior to staining with the viability assay kit, as a live control, and an additional plate was incubated in PBS with 70% ethanol (EtOH). Cells were then imaged with fluorescent microscopy using GFP and rhodamine cube filters to visualize calcein-AM and EthD, respectively. Fluorescent images are shown in Figure S1.
2.5. Photoacoustic microscopy
PA signal acquisition for cell studies used a photoacoustic microscopy (PAM) system described previously[14], with a few modifications. The needle hydrophone (Precision Acoustics LTD, Dorchester, UK) was inserted into the slide chamber and positioned just offset to the laser light path, to avoid generation of a PA signal within the hydrophone itself. Hydrophone signals were amplified using an RF amplifier (2100L, Electronics & Innovation, Inc., Rochester, NY, USA, gain of 50 dB). Laser light was directed into the imaging chamber using mirrors and iris apertures, and focused to a spot size of roughly 40 μm by 50 μm (fluence estimated to be 4 kJ/cm2). Spot size was measured optically at the slide plane using a USAF 1951 positive resolution target (DA009, Max Levy Autograph, Inc., Philadelphia, PA, USA). Figure 2.b shows a diagram of the slide chamber, hydrophone and focused laser.
PAM measurements of cells (with and without Asz treatment) were taken in several positions on multiple slides. Once signal at a given position was observed on an oscilloscope, 300 RF-lines were acquired at 10 Hz. RF-lines were bandpass filtered (0.5 MHz/5 MHz) and normalized to fluence using Matlab software (MathWorks, Inc., Natick, MA, USA).
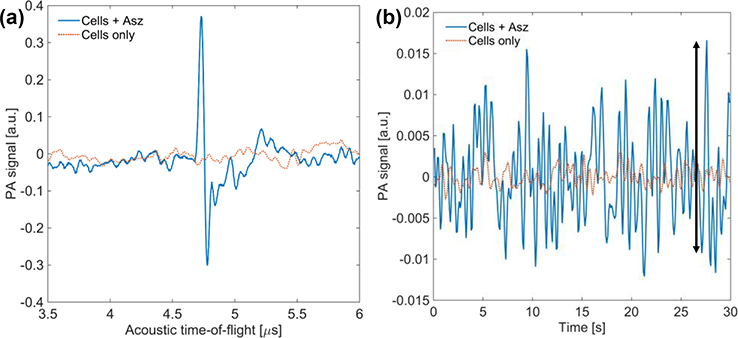
By observing PA signal over a retarded-time 30 second window, we can compare Asz treated and control non-Asz treated cells on time scales that correspond to several depolarization-repolarization cycles. PAM retarded-time data was generated by selecting the subset of each RF-line corresponding to the location of the cells. The peak amplitude was sampled from this subset for each RF-line and used to construct a 30 second retarded-time signal. This signal was then lowpass filtered at 2 Hz. For Asz treated cells, retarded-time amplitude fluctuations should be proportional to cytosolic Ca2+ concentration. Measurements of retarded-time peak-to-peak values were taken (indicated by the black arrow in Figure 5.b) and a box-plot analysis of peak-to-peak data from five Asz-treated cell studies and five control cell studies was done.
Figure 5.
PA RF-line of Asz-treated cells (blue) and control cells (red) (a). Retarded-time signal of Asz-treated cells and control cells (b). Arrow indicates example of peak-to-peak measurement.
3. Results
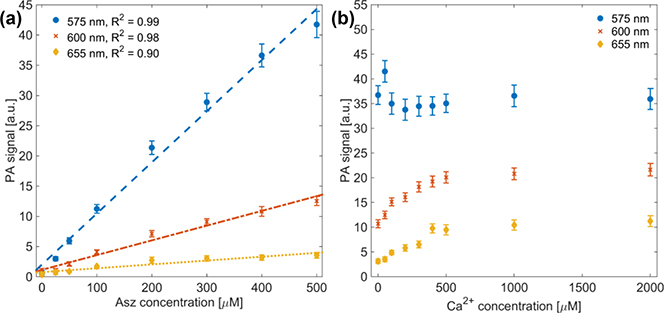
PA phantom results showed linear agreement between PA signal and Asz concentration, as shown in Figure 3.a. The coefficient of determination (R2) was 0.99, 0.98 and 0.90 for 575 nm, 600 nm and 655 nm, respectively, with an average R2 = 0.954.
Fig. 3.
PA signal versus Asz concentration with linear fit (dashed line) to PA data (a). with R2 values of 0.99, 0.98 and 0.90 for 575 nm, 600 nm and 655 nm, respectively. PA signal from 500 μM Asz dye with varying Ca2+:Asz ratio (b). Different colors-markers represent results using 575 nm (blue-circle), 600 nm (red-x) and 655 nm (yellow-diamond) laser light.
PA phantom spectra with varying Ca2+ to Asz ratio also show general agreement with both extinction data using 50 μM Asz, as well as previous results reported by Rowatt, et al,[7]. Both data indicate that at a molar ratio of Ca2+ to Asz equal to one, we expect to see a plateau in the optical extinction at 600 nm, which is reflected in Figure 3.b. Data also indicate that extinction at 575 nm should remain generally constant, which is indicated in Figure 3.b. Data at 655 nm indicate that extinction should continually increase with increasing Ca2+ to Asz ratio up four, but the increase in PA signal at higher ratios was not as pronounced as that predicted by extinction data.
Cells incubated with the fluo-4 AM and imaged with fluorescence microscopy showed obvious variation in fluorescence emission across time-lapse images (Video S2). This result verified cellular depolarization and cytosolic Ca2+ variation.
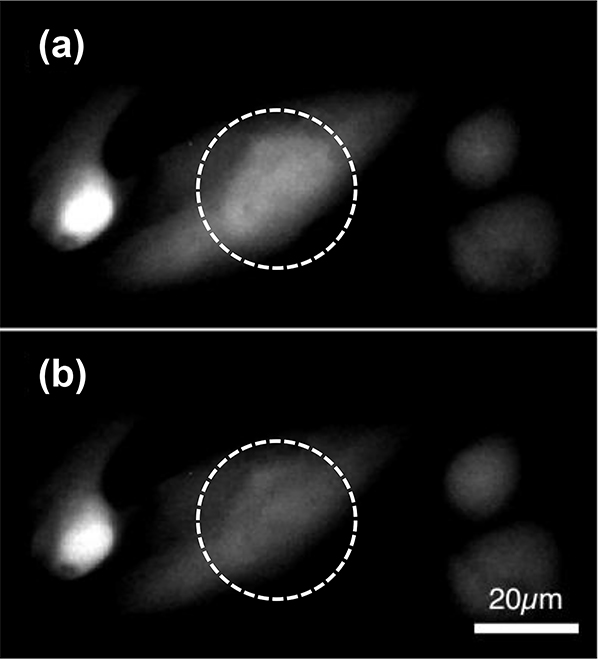
Similarly, cells treated with Asz and imaged using bright field microscopy with a rhodamine filter also showed fluctuation in time-lapse series of images (Figure 4, Video S1). While these optical changes were less obvious than those observed using fluo-4, these images served as verification that Asz was being successfully incorporated into HL-1 cardiac myocyte cytosol and was responding to dynamic Ca2+ concentration changes.
Fig. 4.
Bright field microscopy images, using a red-fluorescent filter, of HL-1 cardiac myocytes incubated with Asz. Images (a) and (b) are part of a time-lapse series, Δt = 10 seconds.
Cell viability images indicate that, following 20 minute Asz treatment, most cells exhibit esterase activity and indicate intact plasma membranes (Figure S1, Asz), suggesting most cells are alive immediately following Asz treatment. Though, when compared to live-control images (Figure S1, PBS), viability results suggest that Asz treatment does decrease cell viability, as indicated by the increased EthD stained cells visible in Columns a and b of Figure S1.
PA RF-line data collected from Asz treated cells and control non-treated cells were compared with respect to their peak PA amplitudes (n = 5, each). RF-line data from Asz treated cells showed, on average, > 100-fold increase in peak RF-line amplitude as compared to control cells (Figure 5.a).
Retarded-time PA data (Figure 5.b) underwent peak-to-peak analysis, indicated by the black arrow in Figure 5.b. Data were compared between Asz treated cells and non-Asz treated cells. For retarded-time data, Asz incubated cells showed, on average, a 10-fold increase in their peak-to-peak standard deviation over the control non-treated cells.
4. Discussion and Conclusion
PA signal observed during phantom studies showed a strong linear relationship to Asz concentration at 575 nm and 600 nm (R2 = 0.99 and 0.98, respectively), as expected, though PA data at 655 nm did not exhibit as strong a linear relationship to Asz concentration (R2 = 0.90). This is likely due to low optical absorption of Asz (w/o Ca2+) at 655 nm, which would reduce signal-to-noise ratio (SNR).
Optical extinction of Asz dye is known to have non-linear absorption based on dye concentration[8], in addition to those absorption changes dependent on pH and cation concentration. As such, quantitative comparisons between PA measurements from phantom studies and UV-Vis molar extinction coefficients could not be made. Nonetheless, the PA data did show increased signal with increasing Ca2+ to Asz ratio at 600 nm and 655 nm and flat signal at 575 nm (Figure 3.b), which qualitatively agrees with UV-Vis data in Figure 1. PA signal at 600 nm exhibited an inflection point near a Ca2+ to Asz ratio of one (Figure 3.b), which agrees with both UV-Vis data (Figure 1) and results from Rowatt, et al[7]. At higher (≥ 2) Ca2+ to Asz ratios, UV-Vis data (50 μM Asz concentration) indicates absorption should be greater at 600 nm than at 575 nm, but this was not observed in PA phantom measurements (500 μM Asz concentration). Furthermore, as mentioned above, the PA signal at 655 nm did not increase as much as UV-Vis data would predict for higher Ca2+ to Asz ratios. These results are likely attributable to the higher (10-fold) Asz concentrations used in PA experiments. At these higher concentrations, the non-linear absorption of Asz may become significant. Previous work by Palade, et al, showed that molar extinction, at a given wavelength, differed by approximately a factor of two when comparing Asz samples whose concentrations varied by a factor of 100[8]. This could account for observed discrepancies between the extinction data and PA phantom results. Unfortunately, initial PA phantom results using matching 50 μM Asz concentration showed poor SNR. To achieve the same SNR using a 10-fold dilute solution, at least 100-fold more averages would be needed, at which point dye photo-bleaching and photo-chemical reactions may impact results. For that reason, a higher Asz concentration was used in PA phantom imaging studies.
HL-1 cells stained with both fluo-4, AM (Video S2) and Asz (Figure 4, Video S1) showed variations in light intensity as observed using fluorescent and bright field microscopy, respectively. While the quality of the images in Figure 4 is low, due to both low light intensity and low contrast, it does indicate that Asz was present in cells and responding to cytosolic Ca2+ concentration. HL-1 cells observed with fluo-4 generally showed poor electrical coupling with their neighbors, which has been observed previously[12]. As such, electrical synchronization occurred only on the order of a few cells, at most, which corresponds to a circular region of roughly 40 μm diameter. The PAM system, utilizing highly focused optical excitation (roughly 40 μm diameter spot size), was able to overcome the issues associated with highly localized depolarization, albeit at the cost of lower SNR.
Asz treated cells showed a significant increase over control cells in their maximum RF-line amplitude (Figure 5.a), as well as a 10-fold increase in the peak-to-peak values in the retarded-time traces (Figure 5.b), suggesting the PAM studies using Asz dye were successful in observing absorption changes resulting from Asz binding/unbinding dynamic cytosolic Ca2+. It should be noted that peak-to-peak analysis was done without any peak-threshold criteria (i.e. minimum increase over the neighboring values). When any peak-threshold criteria was used, very few “peaks” were observed in control retarded-time data, though data from Asz treated cells still demonstrated multiple peaks in all samples. This suggests this technique may have sufficient sensitivity for PA imaging of dynamic Ca2+ concentration to visualize ion changes in vivo, once properly adapted.
Because PA signal generation results from absorbed light, it is not limited by ballistic photon propagation, as other optical techniques are. This technique could potentially allow 3D reconstruction of cellular depolarization at moderate (~ 1 cm) tissue depths. It also has the ability to monitor depolarization in real-time, as was demonstrated herein.
Despite these promising results, there are limitations to be addressed by future studies. Cytosolic Asz dye is known to bind to cellular proteins[15] and produce free radicals[16], and thus likely affects cell viability. We observed, using optical imaging and PA imaging, that cell activity rapidly decreased after Asz treatment, resulting in a very narrow imaging window (10–20 minutes after completion of Asz treatment). Development of non-toxic, ion-sensitive contrast agents is essential to exploring this technique in an animal model. Also, in ideal conditions, direct comparisons of PA data to optical absorption, rather than optical extinction, would be made using equivalent dye concentrations. Such comparisons require comprehensive measurement of absorption and scattering, at multiple dye concentrations and dye to cation ratios, and thus were beyond the scope of this study. Such analysis may be useful to characterize ion-sensitive contrast agents in the future.
In conclusion, these results demonstrate proof-of-concept for contrast-enhanced PA imaging to monitor ion-concentration changes resulting from cellular depolarization. While these initial results are promising, work remains to develop non-toxic, NIR-absorbing, ion-sensitive contrast agents. Ideal agents would exhibit a strong absorption shift in the NIR (preferably at 1064 nm) upon ion binding, and have minimal cytotoxicity. This would also allow translation of contrast-enhanced PA monitoring of dynamic ion concentration to animal models, where electric and ionic coupling will be present up to the organ level. Such studies would allow quantitative comparison of PA data to ECG/EMG measurements, and further assess the potential of this technique to spatiotemporally resolve 3D tissue depolarization.
Supplementary Material
Figure S1. Fluorescent microscopy images following cell viability assay for Asz-treated cells (Asz), PBS treated live-control cells (PBS) and Ethanol treated dead-control cells (PBS + EtOH). Green channel (column a) indicates calcein-AM fluorescence (i.e. esterase activity/live cells), red channel (column b) indicates DNA-bound EthD fluorescence (i.e. disrupted plasma membrane/dead cells), with overlaid images (column c) for comparison. Micrograph scale bar indicates 200 μm scale.
5. Acknowledgements
This work was supported by NIH grant EB015007. Authors disclose that there are no potential conflicts of interest pertaining to the work contained herein.
References and links
- 1.Berridge MJ, Lipp P, Bootman MD. The versatility and universality of calcium signalling. Nat Rev Mol Cell Biol. 2000. October;1(1):11–21. [DOI] [PubMed] [Google Scholar]
- 2.Catterall WA, Few AP. Calcium Channel Regulation and Presynaptic Plasticity. Neuron. 2008. September 25;59(6):882–901. [DOI] [PubMed] [Google Scholar]
- 3.Bers DM. Cardiac excitation-contraction coupling. Nature. 2002. January 10;415(6868):198–205. [DOI] [PubMed] [Google Scholar]
- 4.Herron TJ, Lee P, Jalife J. Optical Imaging of Voltage and Calcium in Cardiac Cells & Tissues. Circ Res. 2012. February 17;110(4):609–23. [DOI] [PMC free article] [PubMed] [Google Scholar]
- 5.Sutherland FJ, Hearse DJ. The isolated blood and perfusion fluid perfused heart. Pharmacol Res. 2000. June;41(6):613–27. [DOI] [PubMed] [Google Scholar]
- 6.Winfree A Electrical turbulence in three-dimensional heart muscle. Science. 1994. November 11;266(5187):1003–6. [DOI] [PubMed] [Google Scholar]
- 7.Rowatt E, Williams RJ. The interaction of cations with the dye arsenazo III. Biochem J. 1989. April 1;259(1):295–8. [DOI] [PMC free article] [PubMed] [Google Scholar]
- 8.Palade P, Vergara J. Stoichiometries of arsenazo III-Ca complexes. Biophys J. 1983. September;43(3):355–69. [DOI] [PMC free article] [PubMed] [Google Scholar]
- 9.Cooley EJ, Kruizinga P, Branch DW, Emelianov S. Evaluation of arsenazo III as a contrast agent for photoacoustic detection of micromolar calcium transients. In 2010. p. 75761J–75761J – 8. Available from: 10.1117/12.842592 [DOI]
- 10.Beard P Biomedical photoacoustic imaging. Interface Focus. 2011. August 6;1:602–31. [DOI] [PMC free article] [PubMed] [Google Scholar]
- 11.Claycomb WC, Lanson NA, Stallworth BS, Egeland DB, Delcarpio JB, Bahinski A, et al. HL-1 cells: A cardiac muscle cell line that contracts and retains phenotypic characteristics of the adult cardiomyocyte. Proc Natl Acad Sci. 1998. March 17;95(6):2979–84. [DOI] [PMC free article] [PubMed] [Google Scholar]
- 12.Geuss LR, Allen ACB, Ramamoorthy D, Suggs LJ. Maintenance of HL-1 cardiomyocyte functional activity in PEGylated fibrin gels. Biotechnol Bioeng. 2015. July 1;112(7):1446–56. [DOI] [PubMed] [Google Scholar]
- 13.Tyrode’s solution. Cold Spring Harb Protoc. 2006. June 1;2006(1):pdb.rec10479. [Google Scholar]
- 14.Cook JR, Frey W, Emelianov S. Quantitative Photoacoustic Imaging of Nanoparticles in Cells and Tissues. ACS Nano. 2013. February 26;7:1272–80. [DOI] [PMC free article] [PubMed] [Google Scholar]
- 15.Beeler TJ, Schibeci A, Martonosi A. The binding of arsenazo III to cell components. Biochim Biophys Acta BBA - Gen Subj. 1980. May 7;629(2):317–27. [DOI] [PubMed] [Google Scholar]
- 16.Docampo R, Moreno SN, Mason RP. Generation of free radical metabolites and superoxide anion by the calcium indicators arsenazo III, antipyrylazo III, and murexide in rat liver microsomes. J Biol Chem. 1983. December 25;258(24):14920–5. [PubMed] [Google Scholar]
Associated Data
This section collects any data citations, data availability statements, or supplementary materials included in this article.
Supplementary Materials
Figure S1. Fluorescent microscopy images following cell viability assay for Asz-treated cells (Asz), PBS treated live-control cells (PBS) and Ethanol treated dead-control cells (PBS + EtOH). Green channel (column a) indicates calcein-AM fluorescence (i.e. esterase activity/live cells), red channel (column b) indicates DNA-bound EthD fluorescence (i.e. disrupted plasma membrane/dead cells), with overlaid images (column c) for comparison. Micrograph scale bar indicates 200 μm scale.


