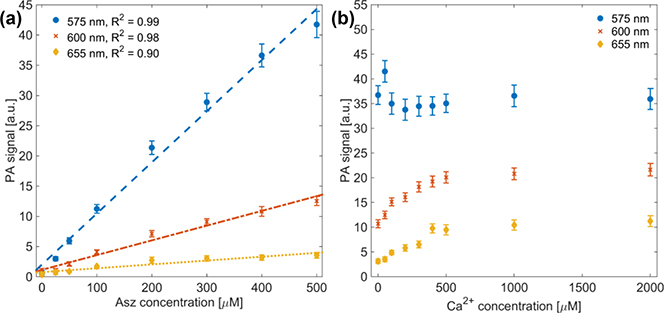
Fig. 3.
PA signal versus Asz concentration with linear fit (dashed line) to PA data (a). with R2 values of 0.99, 0.98 and 0.90 for 575 nm, 600 nm and 655 nm, respectively. PA signal from 500 μM Asz dye with varying Ca2+:Asz ratio (b). Different colors-markers represent results using 575 nm (blue-circle), 600 nm (red-x) and 655 nm (yellow-diamond) laser light.

