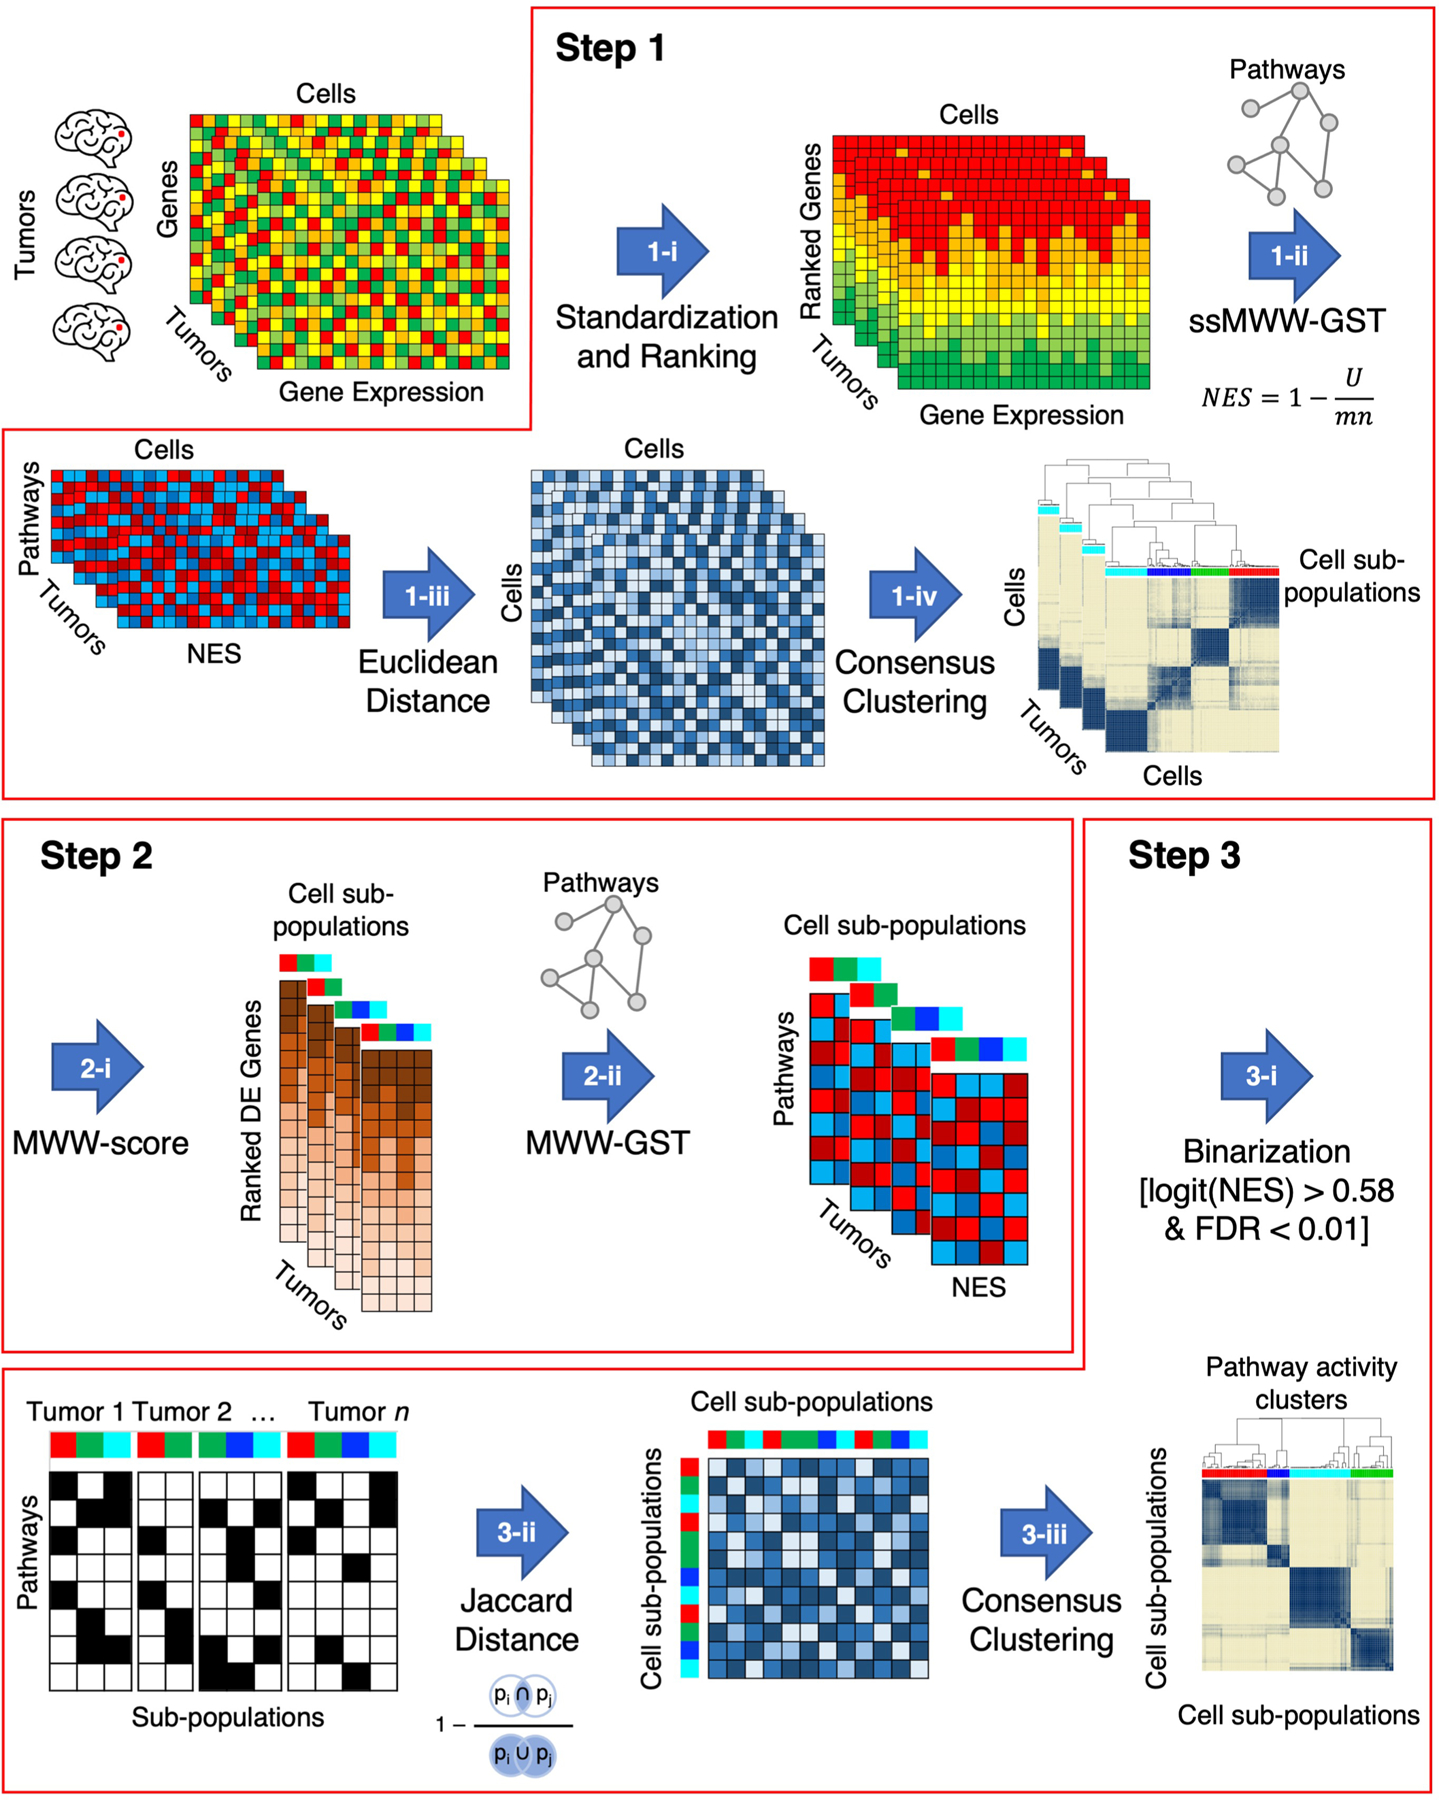
Extended Data Fig. 1 |. The computational framework of scBiPaD.

Step 1: identification of cell sub-populations of cells in each individual tumor that share activation of similar biological functions; Step 2: determination of enriched biological pathways in each cell sub-population by defining cluster-specific ranked-lists; Step 3: identification of cell sub-populations that share coherent biological functions across multiple tumors. In Step 1-i, the ranked list for each cell in each tumor is obtained by standardizing and ranking genes. The activity matrix (NES) of all cells composing each tumor is obtained by calculating the single-sample activity of all the 5,032 biological pathways with ssMWW-GST (Step 1-ii) and used to generate the Euclidean distance between every pair of cells in each tumor (Step 1-iii). Finally, the cell sub-populations of each tumor are identified by applying the consensus clustering on the basis of the Euclidean distance of the NES (Step 1-iv). In the following step (Step 2-i), the MWW-score is used to generate a cluster-specific ranked-list of genes for each cell sub-population by comparing the expression profiles of the cells in the cluster with all other cells in the same tumor. The enriched biological pathways of each cell sub-populations are derived in Step 2-ii by using MWW-GST as in Step 1-ii. Each cell sub-population is then represented by a binary vector, with 1 indicating the enriched biological pathways (Step 3-i) and the binary matrix is used in Step 3-ii to derive the Jaccard distance. In the last step, 3-iii, cell sub-populations are clustered by Jaccard distance using consensus clustering.
