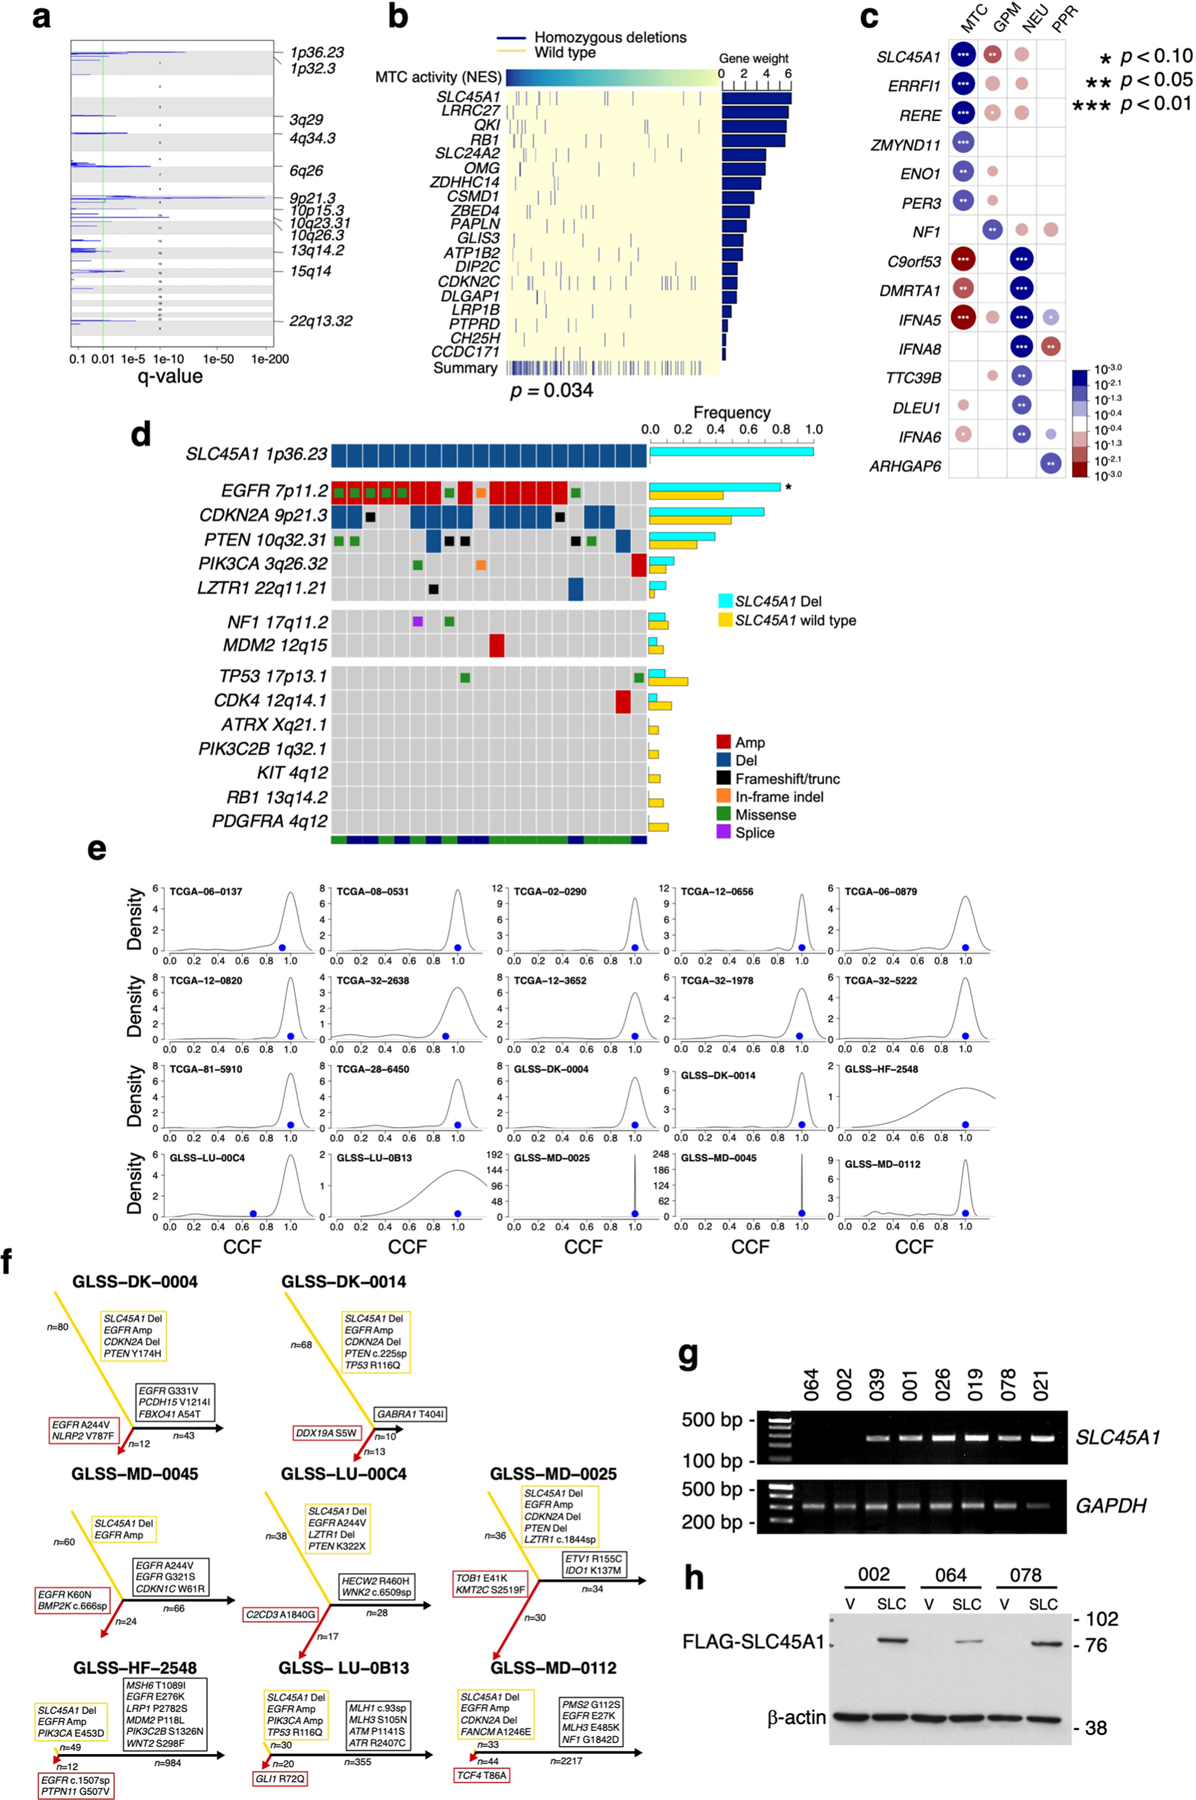
Extended Data Fig. 10 |. SLC45A1 is the target of chromosome 1p36.23 deletion in MTC GBM.

a, Schematics of chromosome location peak deletions in MTC GBM (n = 153 tumors) identified using GISTIC2 (Benjamini Hochberg FDR q-value < 0.01; q-value of chromosome bands are reported in Supplementary Table 16b). b, The matrix of homozygous deleted genes identified by UNCOVER as associated with MTC NES in primary GBM (n = 487 tumors; p = 0.034, permutation test). Top row, blue to yellow: higher to lower NES values for samples (columns). Deletions in each sample are in dark blue; samples not deleted are in yellow. The last row shows the alteration profile from the entire analysis. The bar plot on the right side indicates the gene weight for each alteration. c, Association of homozygous deletions in each GBM subtype. Circles are color-coded and their dimension reflects the -log10(p-value) of the enrichment (n = 487 tumors; p-value, two-sided Fisher’s exact test; see Supplementary Table 16g). Blue to red scale indicates positive to negative association. d, Frequency of genetic alterations of GBM driver genes in SLC45A1-deleted (n = 20 tumors) compared to SLC45A1 wild-type GBM (n = 705 tumors). The bottom track indicates the dataset (green, TCGA; blue, GLASS). Asterisk, p = 2.33e-03, two-sided Fisher’s Exact test (n = 725 tumors). e, Sample density plot depicting the relative frequency distribution of CCF estimated for the genetic alterations occurring in SLC45A1-deleted GBM (n = 20 tumors). Blue dot, CCF of SLC45A1 deletion. f, Evolutionary trees of genetic alterations in primary and recurrent SLC45A1-deleted GBM (n = 8 matched primary and recurrent tumor pairs); yellow, red and black branches are truncal, primary private and recurrent private alterations, respectively; the length of branches is proportional to the number of genetic alterations. GBM driver genes are indicated. g, PCR amplification of genomic DNA shows deletion of SLC45A1 in PDC-002 and PDC-064. h, Immunoblot of FLAG-SLC45A1 in PDC-002, PDC-064 (harboring SLC45A1 deletion) and PDC-078 (SLC45A1 wild type). Experiments in g, h were repeated two times with similar results. See Source Data Extended Data Fig. 10.
