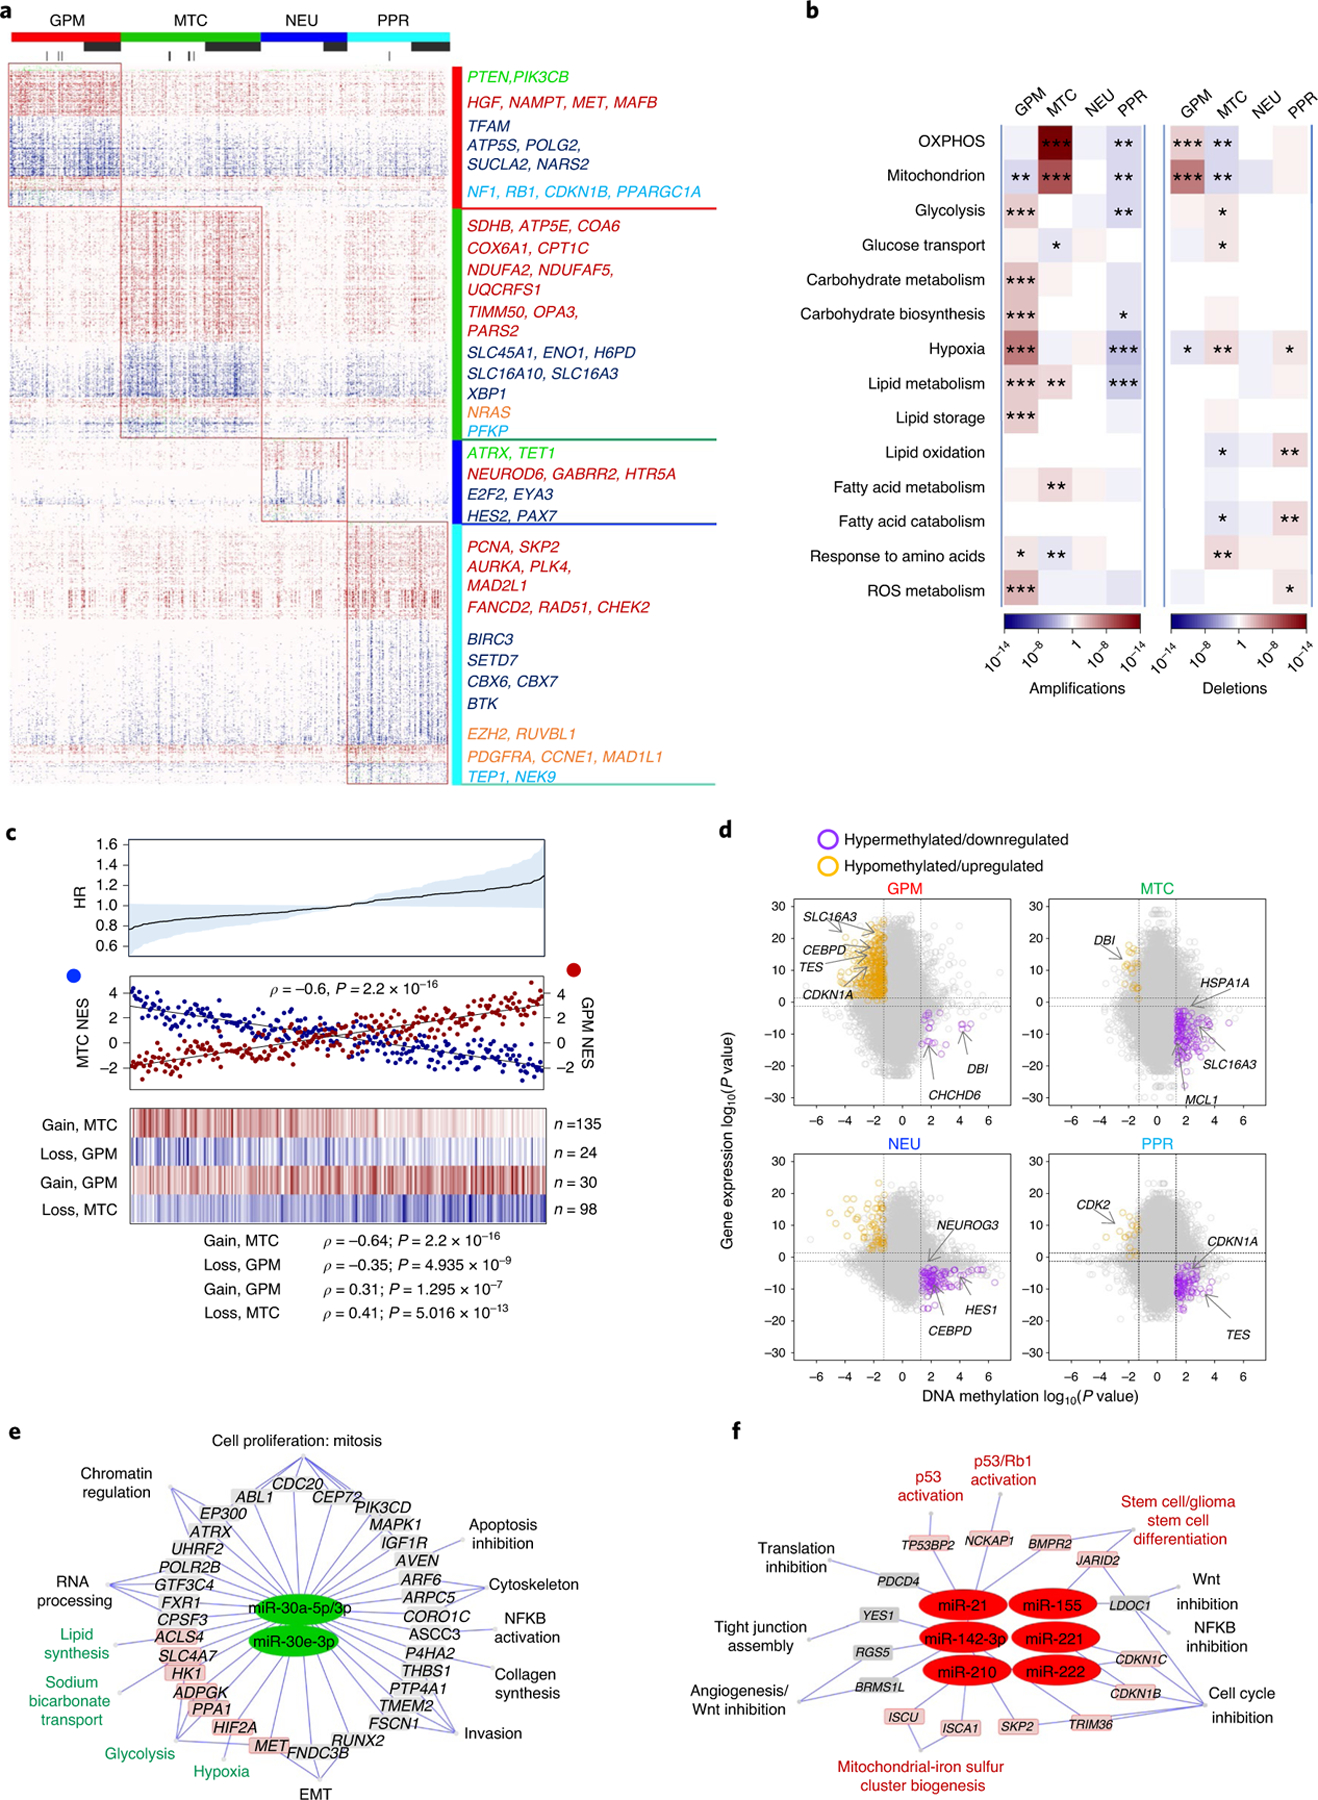
Fig. 4 |. Reciprocal MTC and GPM activities are associated with coherent gain- and loss-of-function genetic alterations and predict risk of failure.

a, Mutations and/or CNVs significantly associated with GBM subclasses (n = 496 tumors); P < 0.05, two-sided Fisher’s exact and χ2 test; P values of individual genes are reported in Supplementary Table 12b–u). Columns represent tumors and rows are genes. Horizontal top and vertical color bars: GBM subtypes; horizontal middle and bottom bars: white and gray, samples with or without mutation (middle) or CNV (bottom) data, respectively. Representative gene alterations specific to each GBM subtype are indicated by color: green, mutation; red, amplification; blue, deletion; orange, mutation/amplification; cyan, mutation/deletion. b, Metabolic pathway enrichment analysis of amplifications (left) and deletions (right) in GBM subtypes. Red-to-blue scale, positive to negative enrichment (P value) of gene alterations in the pathway; *P < 0.10, **P < 0.05, ***P < 0.01, two-sided Fisher’s exact test. c, Top: HR for patients with GBM according to Cox’s proportional hazards model, testing the difference between GPM and MTC activities as the covariate (n = 273 tumors, P = 0.05; shaded area represents 95% CI). Middle: correlation analysis of MTC (blue) and GPM (red) activities in individual GBM (n = 273 tumors, Spearman’s correlation, ρ = −0.6, P = 2.2 × 10⁻¹⁶). Bottom: fCNV gain and loss of mitochondrial- and glycolytic-related genes in MTC GBM and GPM GBM. The number of genes amplified/deleted in each tumor is color coded (amplifications, red to white; deletions, blue to white). In all panels, n = 153 MTC and n = 120 GPM tumors. d, Starburst plots comparing DNA methylation and gene expression for 10,337 unique genes. Dashed lines indicate P = 0.01 (n = 59 tumors, two-sided MWW test). The bottom right and top left areas of each plot include genes significantly hypermethylated and downregulated (purple) or hypomethylated and upregulated (orange), respectively, in the specific subtype. e,f, Micro RNA gene target networks were significantly changed in subtypes MTC (e, green nodes) and GPM (f, red nodes) (n = 294 tumors; log2(fold change (FC)) > 0, P < 0.0005, two-sided MWW test). For each miRNA, we report targets whose expression was anticorrelated with miRNA expression (n = 294 tumors; Spearman’s correlation, ρ < 0 and P < 0.05). Highlighted are miRNA targets of interest regarding the biology of subtypes MTC and GPM GBM. P values for miRNAs and targets are included in Supplementary Table 14c. NFKB, nuclear factor kappa B; Wnt, wingless-related integration site.
