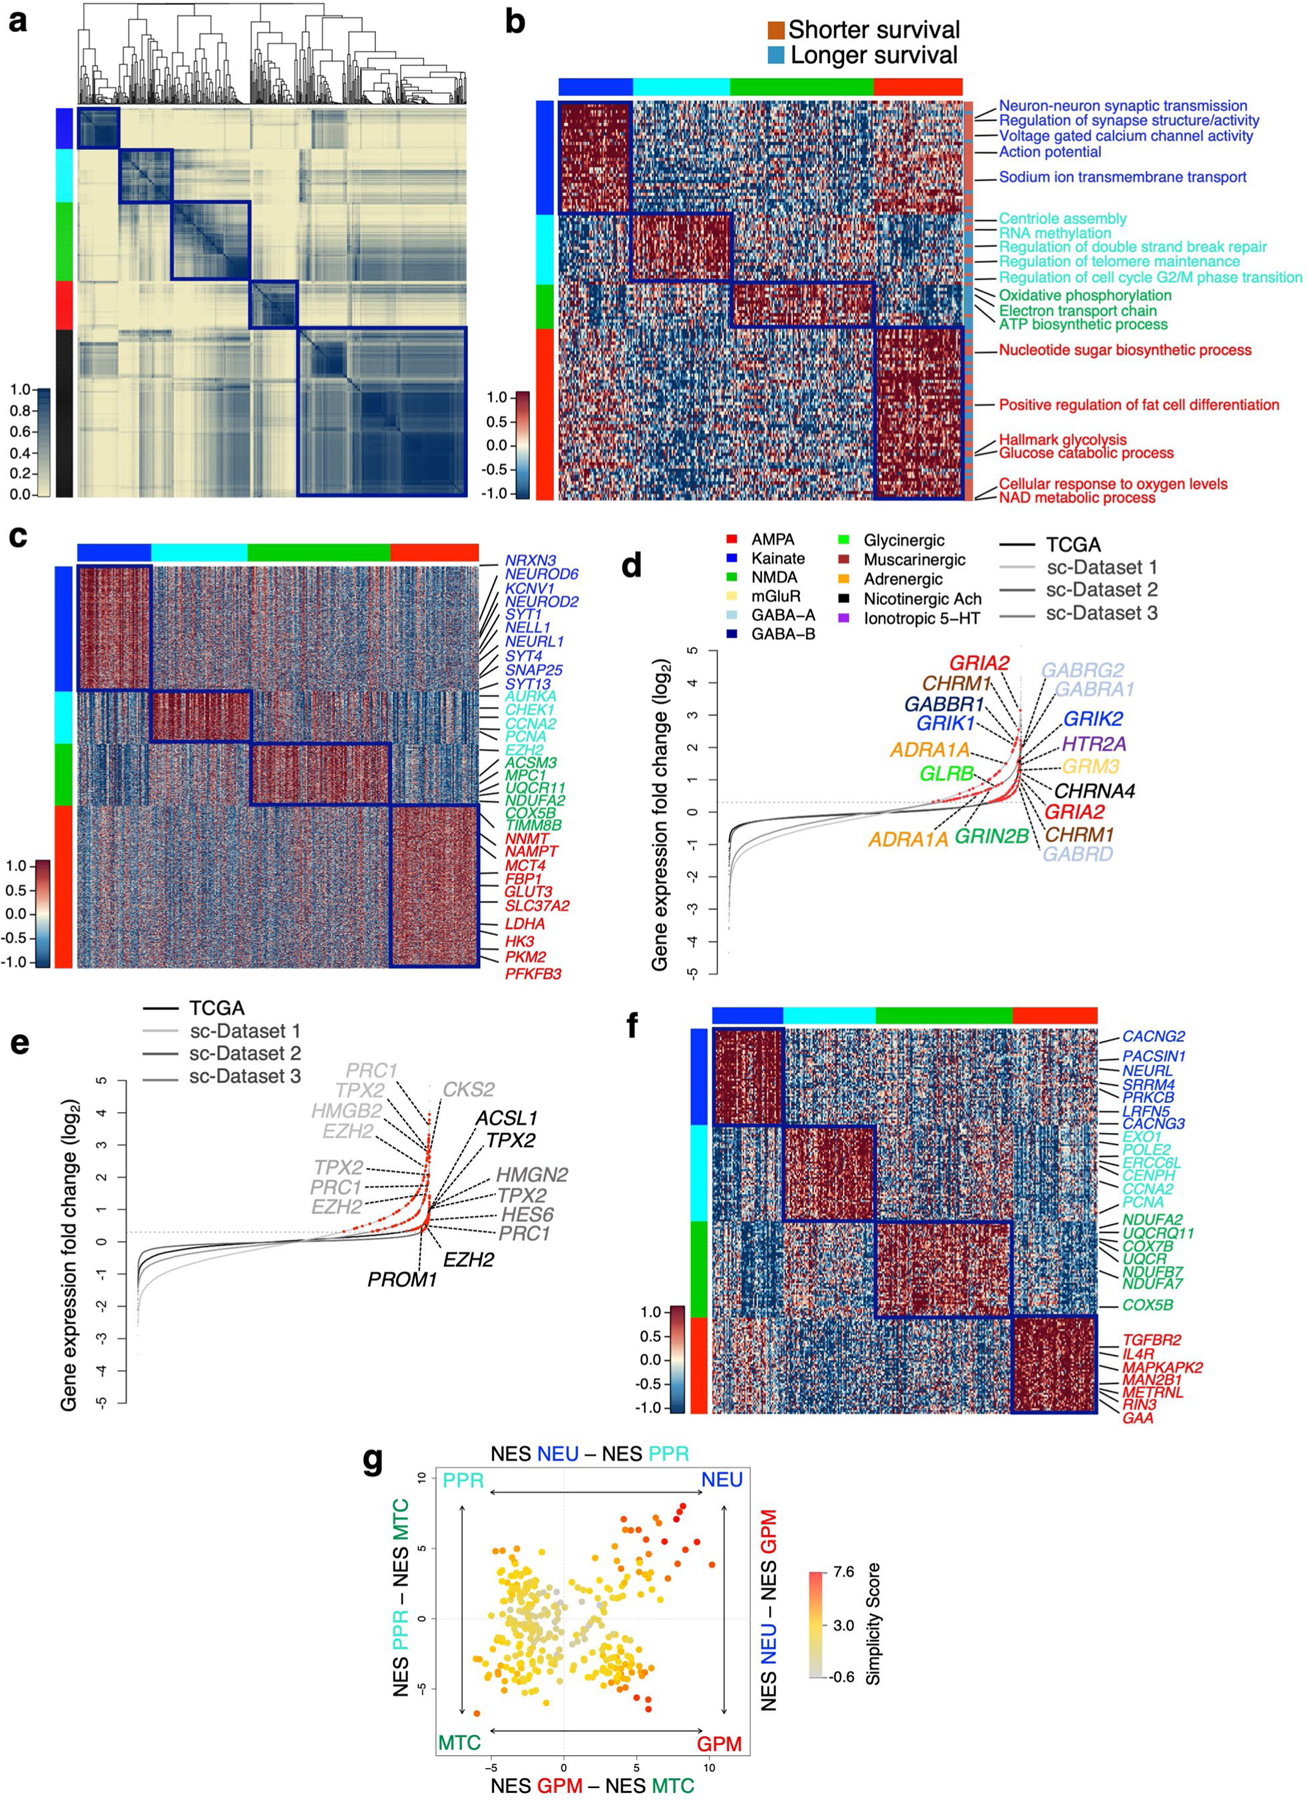
Extended Data Fig. 5 |. Characterization of biological subtypes of bulk primary GBM.

a, Consensus clustering of 534 GBM on the activity of 192 survival-associated pathways (p < 0.05, log-rank test; p-value of individual pathways are reported in Supplementary Table 6b). Columns and rows are individual tumors. Left track: red, GPM; green, MTC; blue, NEU; cyan, PPR; black, unclassified. b, Heatmap of pathway activity in 304 classified GBM including 126 out of 192 survival-associated and differentially active pathways in the four GBM subtypes (effect size > 0.3 and FDR < 0.01, two-sided MWW test). Columns are individual tumors and rows are pathway activity. Pathways characteristically activated in each core subtype are indicated. Left and top tracks: red, GPM; green, MTC; blue, NEU; cyan, PPR. c, Heatmap of genes differentially expressed and upregulated in GBM subtypes (n = 304 tumors; Kruskal-Wallis analysis with post hoc correction by Nemenyi’s test for multiple comparison; FDR < 0.01 and log2(FC) > 0.5). Columns are individual tumors, rows are genes. Representative genes specifically upregulated in each GBM subtype are indicated. Tracks are as in b. d, Rank order plot of changes of genes expressed in GBM NEU. Genes are ranked from left to right in increasing expression order. Red dots indicate neurotransmitter receptors differentially expressed in NEU tumors and cells (n = 2,799 cells for dataset 1, n = 9,652 cells for dataset 2, n = 4,916 cells for dataset 3, n = 304 tumors for TCGA dataset; log2(FC) > 0.3, FDR < 0.05, two-sided MWW test). For each dataset, upregulated genes in neurotransmitter receptor families are indicated by colors. e, Rank order plot of changes of genes expressed in GBM PPR. Genes are ranked as in d. Red dots indicate neural progenitor genes differentially expressed in each dataset (n = 2,799 cells for dataset 1, n = 9,652 cells for dataset 2, n = 4,916 cells for dataset 3, n = 304 tumors for TCGA dataset; log2(FC) > 0.3, FDR < 0.05, two-sided MWW test). Representative genes differentially expressed in at least three datasets are indicated. f, Heatmap showing the 50 highest scoring genes of the four GBM subtypes-specific signatures. Rows are genes and columns are tumors (n = 304 tumors). Track are as in b, c. g, Two-dimensional representation of GBM subtype enrichment scores (n = 304 tumors). Quadrant are GBM subtypes, the position of dots (tumors) reflects the relative subtype-specific score of each tumor as indicated by x- and y-axes, and their color the subtype simplicity score. Gray, tumors that do not fall in the respective subtype quadrant.
