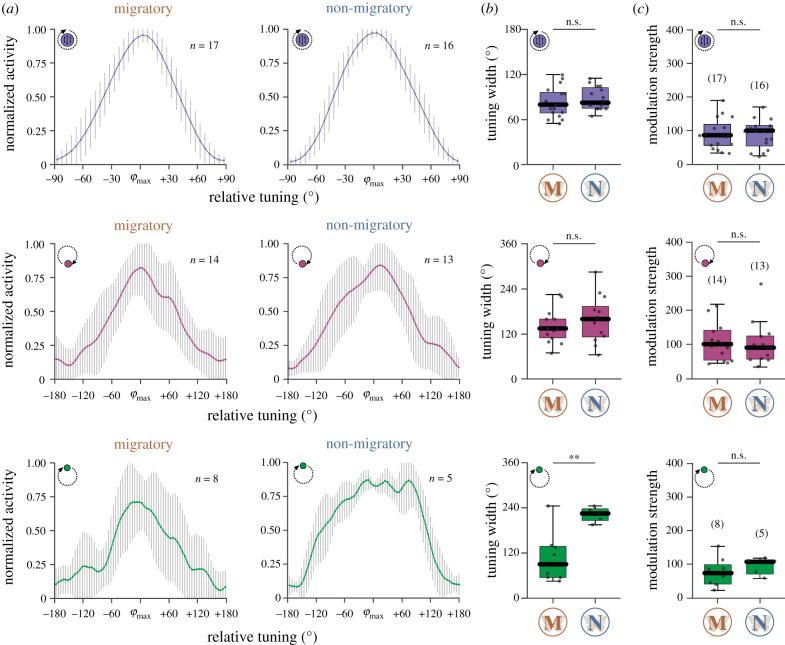
Figure 3.
Comparison of the tuning shapes between migratory (M) and non-migratory (N) animals to polarized light (top), UV light (middle) and the green light (bottom). (a) Averaged tuning curves (bin size 5°) of the TL cells in migratory (left) and non-migratory animals (right). The n-size refers to the number of analysed cells. The error bars indicate the standard deviations. (b) While the tuning widths (full width at half maximum) of the responses to polarized light (p = 0.41, t-distribution = −0.84) and the UV light (p = 0.37, t-distribution = −0.92, unpaired t-test) were similar between the forms, a difference was found for the green light (p = 0.004, t-distribution = −3.66, unpaired t-test). (c) The modulation strengths to polarized light (p = 0.99, Z = 0.02), the UV light (p = 0.79, Z = 0.27) and the green light (p = 0.44, rank sum = 50.00) did not differ between migratory and non-migratory butterflies. Individual data points are represented by black dots. Boxes of the box plots display the interquartile ranges. Whiskers extend to the 2.5th and 97.5th percentiles. Black horizontal lines indicate the median. Sample size is shown in brackets (c). n.s., not significant (b,c)., **p < 0.01 (b). (Online version in colour.)

