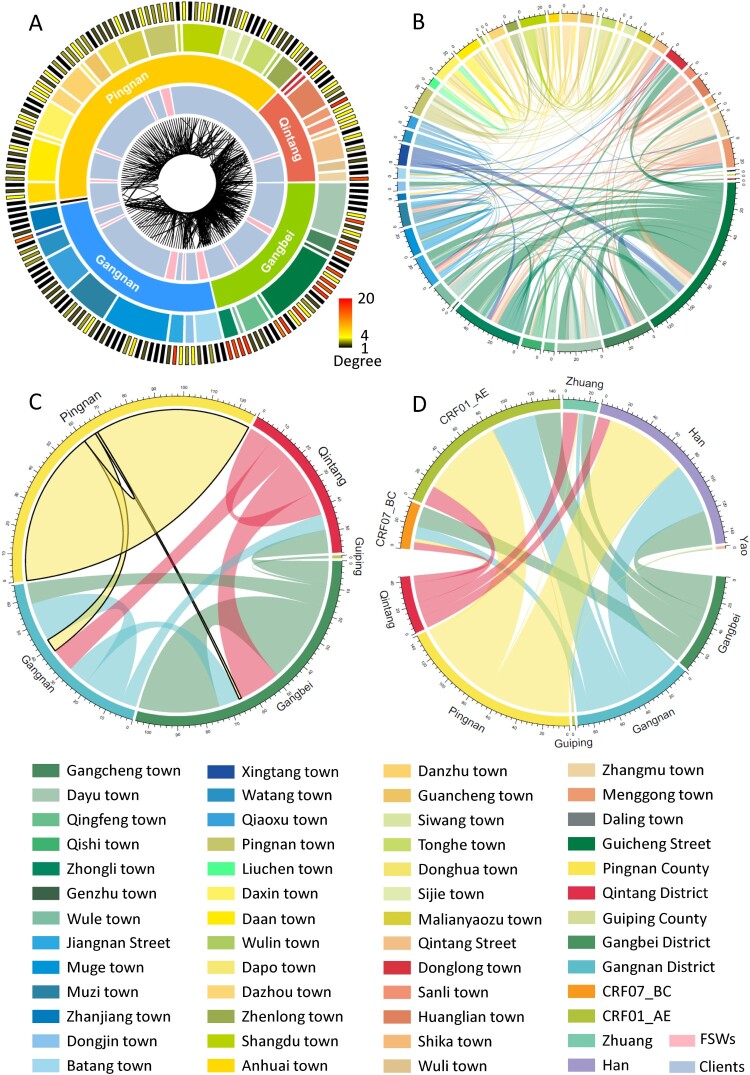
Figure 4.
Distribution, interconnections and demographic characteristics of the individuals involved in the molecular genetic transmission network. A. Each bar in the outermost circle represented an individual in the network. The colors depended on degrees: black: 1 degree; yellow: 4 degrees; red: 20 degrees. The second circle was the region. The innermost circle was the interconnection between individuals, and this connection originated from the edges of the molecular transmission network. B. To further visualize town-to-town connection. C. The interrelationships between regions were manifested. D. The diagram graphically depicted the relationship between the location and ethnicities and subtypes, respectively.

