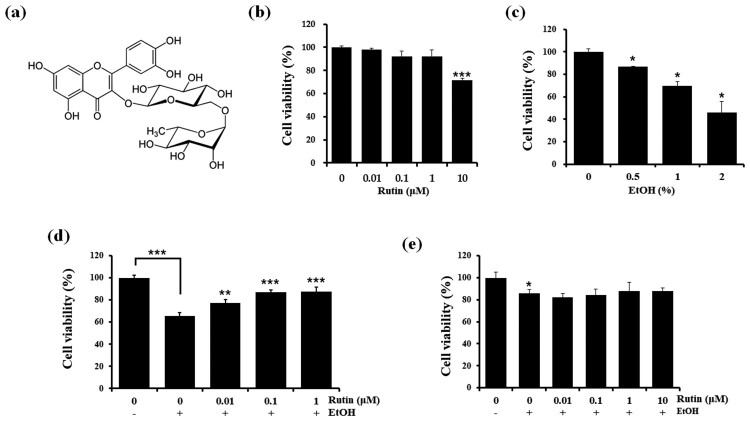
Figure 1.
Chemical structure of rutin (a).and cell viability of rutin and ethanol treated HepG2 cells and zebrafish larvae. (b) Viability of HepG2 cells treated with different concentrations of rutin (0–10 μM) for 1 day. (c) Viability of HepG2 cells at different concentration of ethanol (0–2%). (d) Viability of HepG2 cells treated with ethanol and rutin. (e) MTT assay of zebrafish larvae (4 dpf) incubated with different concentrations of rutin (0–1 μM) and 2% ethanol for 24 h. Data are means ± SEM of triple independent experiments. *p < 0.05, **p < 0.01, and ***p < 0.001.

