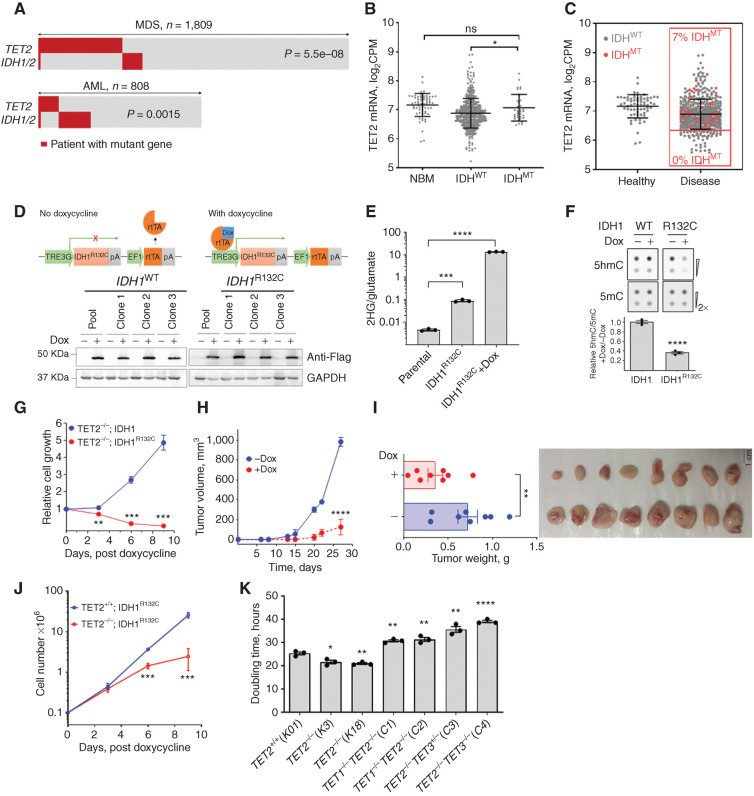
Figure 1.
Effect of 2HG-producing IDH1/2 mutations on TET2MT cells. A, Analysis of TET2 and IDH1/2 mutations in patients with myeloid neoplasia. IDH1/2MT in patients with TET2MT within a CCF cohort of 1,809 MDS patients and TCGA and Beat AML cohorts of 808 patients with AML were analyzed for the co-occurrence of TET2 and IDH1/2 mutations (P values are from Fisher exact test). B, Comparison of TET2 expression among normal healthy donor and myeloid neoplasia patients carrying wild-type or mutant IDH1/2 from different cohorts including Beat AML (www.vizome.org). NBM, normal bone marrow–derived mononuclear cells. C, Distribution of IDH1/2MT and TET2 expression in patients with myeloid neoplasia. Red dots are mutant IDH1/2; no mutations were observed in low TET2-expressing population defined as half of the mean expression of controls. D, Inducible expression of 3XFlag-IDH1 or -IDH1R132C in SIG-M5 cells. Cells were treated with 1 μg/mL doxycycline (Dox) for 3 days. Anti-Flag antibody was used in Western blotfor the detection of induced IDH1 and IDH1R132C. Three independent clones from each cell line along with their pool were analyzed for the expressionanalysis. E, Production of 2HG measured by LC-MS/MS. Cells were treated with or without 1 μg/mL Dox for 3 days, followed by 2HG extraction and analysis. F, Dot blot analysis and quantification of 5hmC and 5mC in the IDH1-inducible SIG-M5 cell line. Cells were treated with or without 1 μg/mL Dox for 3 days. Sodium ascorbate at a final concentration of 100 μmol/L was added 12 hours before harvesting the cells for DNA extraction. G, Effect of 2HG-producing IDH1R132C on the growth of SIG-M5 cells. Cells (105/mL) were treated with 1 μg/mL Dox, and cell proliferation was monitored. The total cell output was plotted as a function of time. H and I, Tumor growth of SIG-M5-IDH1R132C cells in NSG mice (n = 8/group) was monitored upon doxycycline treatment. J, Cell growth curve of K562 TET2+/+ and TET2−/− cells after inducing IDH1R123C expression. K, Doubling time of K562 isogenic TET-mutant cells. Indicated TET dioxygenase genes were knocked out using CRISPR-Cas9, and the genotypes were confirmed by Western blot analysis and Sanger sequencing. The doubling times were determined by exponential growth curve fitting in GraphPad Prism. Three independent clones of each cell line were used in E–G and J. Three biological replicates were used in K. Experiments were performed at least twice for E–G, J, and K. Data, mean ± SEM; statistical significance (P values) from two-tailed t test (except for A) is indicated; *, P < 0.05; **, P < 0.01; ***, P < 0.001; ****, P < 0.001; ns: not significant.

