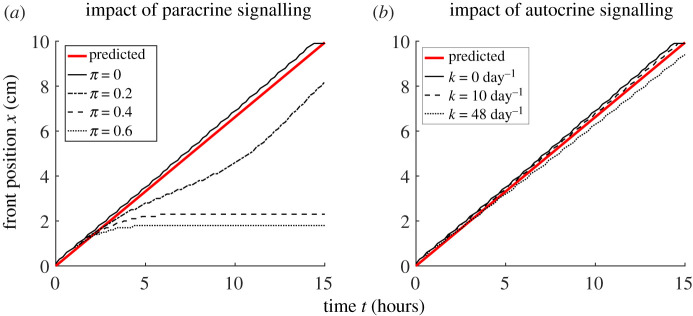
Figure 3.
Comparison of the impacts of paracrine signalling and autocrine signalling on viral spatial spread. Shown is the position x(t) of the infection front over time for various values of the IFN production parameter π while keeping k = 0 and the autocrine-mediated transition rate k while keeping π = 0. Here, we define the front position x(t) to be the position that 1% of total cells are infected, i.e. I(x(t), t) = 0.01T0. (a) Sufficiently strong paracrine signalling, e.g. setting π = 10 and k = 0, leads to halting the spread of infectious front. (b) Strong autocrine signalling, e.g. setting π = 0 and k = 8 day−1, impact modestly on the speed of the viral spread. The red lines show the predicted front position given the analytically derived wave speed in equation (3.1). (Online version in colour.)

