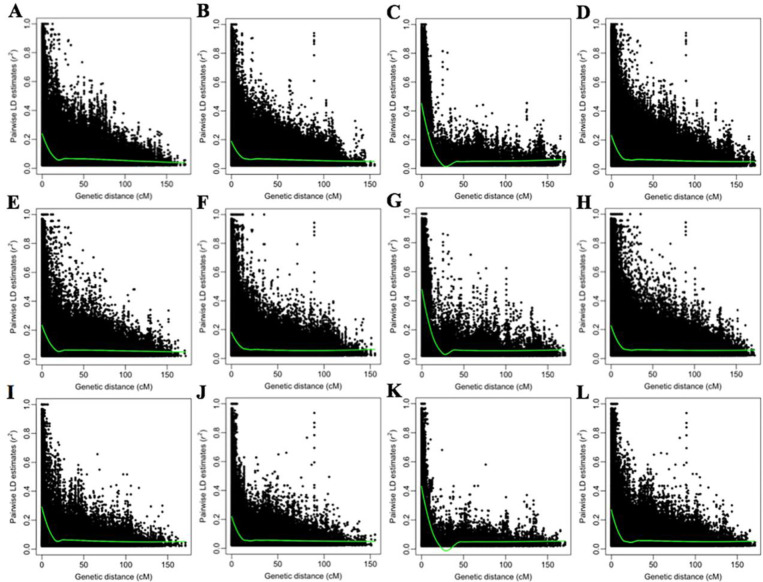
Fig 3. Overview of the linkage disequilibrium (LD) within the whole association panel (WAP), subpopulation-I (SBP-I), and subpopulation-II (SBP-II).
The figure indicates the LD decay estimated as the squared correlation coefficient (r2) using pairwise markers plotted versus genetic distance (cM) for A genome (A, E, and I), B genome (B, F, and J), D genome (C, G, and K), and whole-genome (D, H, and L), respectively in the WAP, SBP-I, and SBP-II. The green curve lines were fitted to LD by the LOESS regression model.

