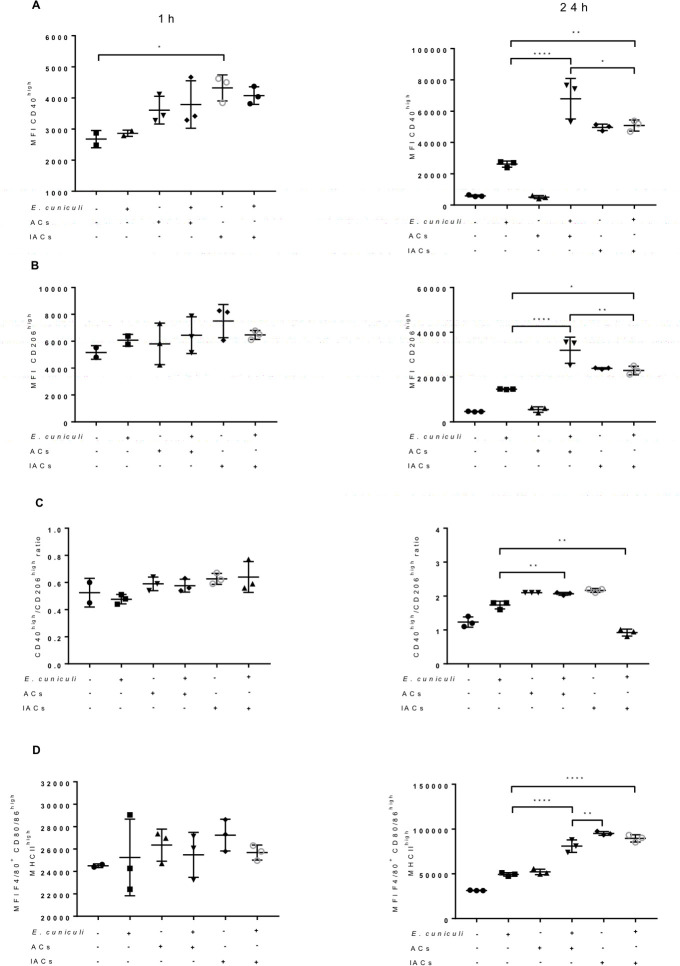
Fig 8. Expression of polarization and activation surface markers in pre-incubated (+) or not (–) macrophages with apoptotic cells (ACs) or infected apoptotic cells (IACs) and challenged (+) or not (–) with E. cuniculi, after an hour or 24 h of observation.
(A) Median fluorescence (MFI) for CD40 in macrophages. (B) MFI for CD206 in macrophages. (C) The ratio between MFI CD40/MFI CD206. (D) MFI for CD80/86 and MHC II in macrophages. One-way analysis of variance (ANOVA) with Tukey’s post-test revealed significance between the groups. *p < 0.05, **p < 0.01, ***p < 0.001.

