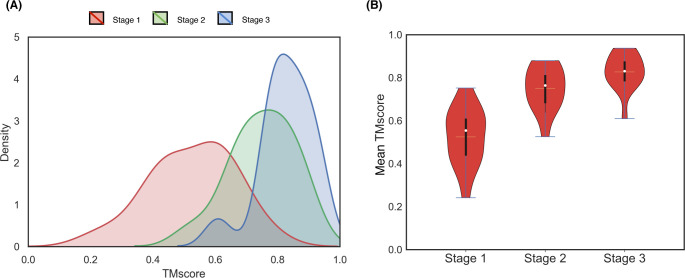
Fig 8. Stagewise TM-score distributions of the reconstructed models on 15 proteins from the EVfold set.
Stage-by-stage (A) density plots and (B) violin plots are shown with the means indicated using the unfilled circles, the medians indicated using the horizontal yellow lines, and the interquartile ranges indicated using the vertical black strips.

