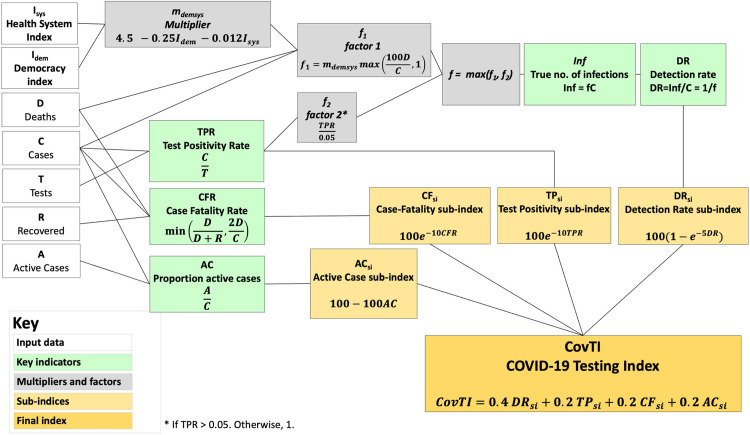
Fig 1. Schematic diagram illustrating method to compute the COVID-19 Testing Index (CovTI).
The CovTI was computed from a weighted sum of the four sub-indices (orange), each of which is derived from one key indicator (green). The input data for each indicator (white) and intermediate steps (grey) are shown.

