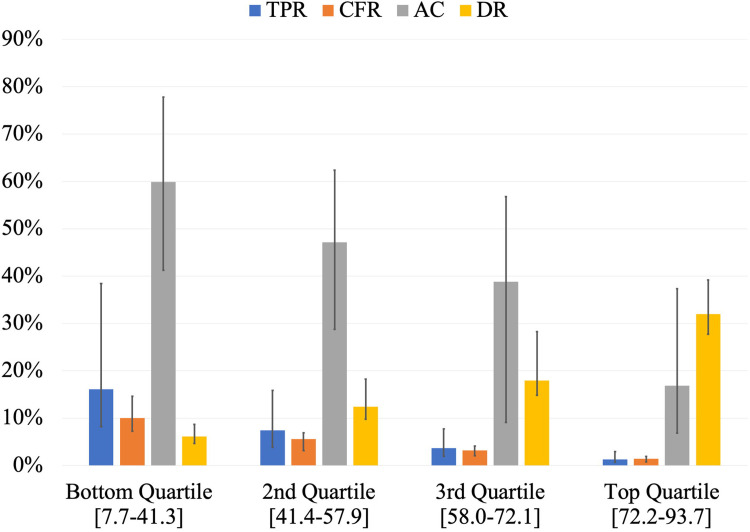
Fig 3. Comparison of the medians of Test Positivity Rate (TPR), Case Fatality Rate (CFR), proportion of Active Cases (AC), and Detection Rate (DR) among the quartiles of COVID-19 Testing Index (CovTI).
Bottom quartile included the lowest 25% of CovTI values (n = 42), 2nd quartile included CovTI values between 25th and 50th percentiles (n = 41), 3rd quartile included CovTI values between 50th and 75th percentiles (n = 41), and the top quartile included highest CovTI values above 75th percentile (n = 41). Values in brackets indicate the range of CovTI values in each quartile. Error bars represent interquartile range. Data per 00:00 GMT June 3, 2020.

