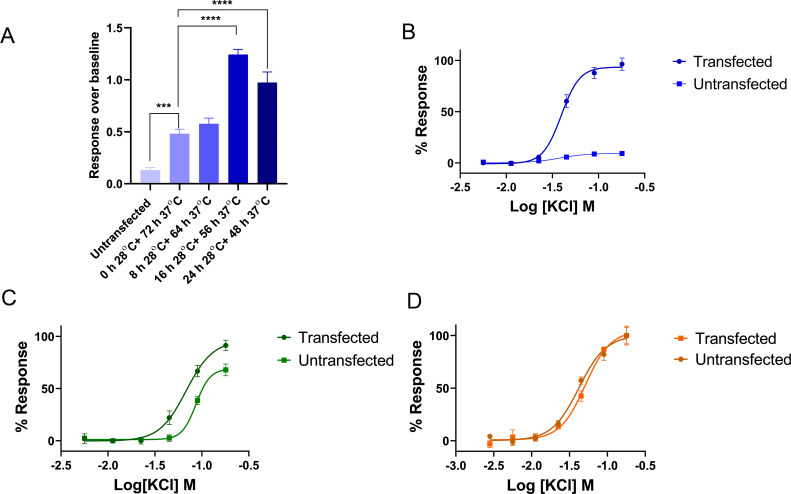
Fig 4. The optimization of transient transfection.
(A) The comparison of 90 mM KCl-evoked fluorescence response from HEK293T cells transfected with CaV2.2, incubated in four different temperature conditions. The response over baseline from untransfected cells was 0.12 ± 0.0, which was significantly lower compared to transfected cells. The response over baseline from transfected cells incubated 72h at 37°C, 8h at 28°C plus 64h at 37°C, 16h at 28°C plus 56h at 37°C, and 24h at 28°C plus 48h at 37°C were 0.5 ± 0.0, 0.6 ± 0.0, 1.2 ± 0.0, and 1.0 ± 0.1. (B) The concentration response curve of KCl-evoked Ca2+ response from transfected and untransfected HEK 293T cells, EC50 = 39.7 ± 0.3 mM for transfected cells. (C) The concentration response curve of KCl-evoked Ca2+ response from transfected and untransfected COS-1 cells, EC50 = 68.7 ± 1.2 mM for transfected cells. (D) The concentration response curve of KCl-evoked Ca2+ response from transfected and untransfected CHO-K1 cells, EC50 = 42.5 ± 2.2 mM for transfected cells. Transfected COS-1 and CHO-K1 cells gave similar response to the corresponding untransfected cells due to low expression level. Data are represented as mean ± SEM (N = 3 independent experiments conducted in triplicate), *** and **** denotes P < 0.001 and P < 0.0001, respectively.

