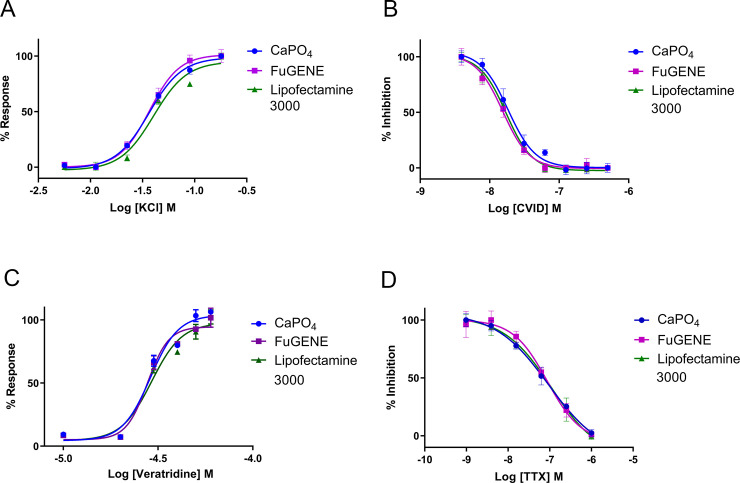
Fig 6.
(A) Representative concentration response curves of the KCl-evoked CaV2.2- responses in HEK 293T cells transfected by calcium phosphate (EC50 38.1 ± 2.3 mM), FuGENE (EC50 36.1 ± 0.3 mM) and Lipofectamine 3000 (EC50 39.7 ± 0.3 mM). (B) Representative concentration response curves of CVID inhibition of 90 mM KCl-evoked CaV2.2 responses in HEK 293T cells transfected by calcium phosphate (IC50 19.5 ± 0.6 nM), FuGENE (IC50, 15.2 ± 1.6 nM) and Lipofectamine 3000 (IC50 15.5 ± 1.1 nM). (C) Representative concentration response curves of veratridine-evoked NaV1.7 responses in HEK 293T cells transfected by calcium phosphate (EC50 28.6 ± 0.4 μM), FuGENE (EC50 28.9 ± 0.7 μM) and Lipofectamine 3000 (EC50 29.9 ± 1.0 μM). (D) Representative concentration response curves of TTX inhibition of 40 μM veratridine evoked activation of NaV1.7 in HEK 293T cells transfected by calcium phosphate (IC50 98.1 ± 3.4 nM), FuGENE (IC50 95.4 ± 7.0 nM) and Lipofectamine 3000 (IC50 101.7 ± 5.4 nM). Data are represented as mean ± SEM (N = 3 independent experiments conducted in triplicate).

