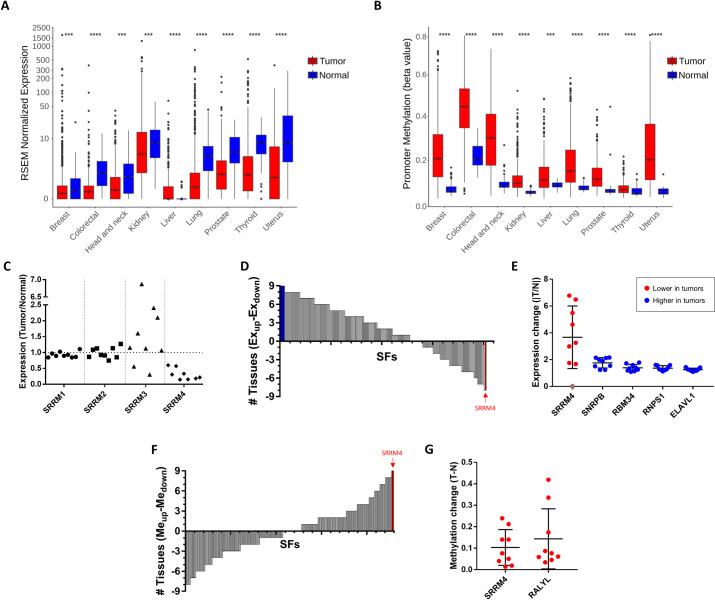
Fig 2. Analysis of TCGA data reveals SRRM4 silencing in cancer across tissue types.
(A) Changes in SRRM4 expression between normal and tumor samples (2-tailed unpaired Wilcoxon–Mann–Whitney test; * p < 0.05, ** p < 0.01, *** p < 0.001, **** p < 0.0001. Boxes expand from the first to the third quartile, with the center values indicating the median. The whiskers define a confidence interval of median ± 1.58*IQR/√(n)). (B) Changes in SRRM4 promoter methylation between normal and tumor samples (2-tailed unpaired Wilcoxon–Mann–Whitney test; * p < 0.05, ** p < 0.01, *** p < 0.001, **** p < 0.0001. Boxes expand from the first to the third quartile, with the center values indicating the median. The whiskers define a confidence interval of median ± 1.58*IQR/√(n)). (C) SRRM4 is the only SRRM gene family member with consistently changing expression across tissues. Each point in the plot represents the ratio of median expression values between tumor and normal samples for 1 tissue. (D) The sum of the number of tissues with significantly up-regulated (positive) and down-regulated (negative) expression in tumors, for each of the 202 SFs. (E) Fold change in median expression of the 4 SFs that consistently increase across all tumor types (blue) and SRRM4, which decreases in tumors (red), with each point representing 1 tissue. SRRM4 expression in liver, which has a median value of 0.0, is shown in gray. Error bars represent SD. (F) The sum of the number of tissues with significantly up-regulated (positive) and down-regulated (negative) methylation in tumors, for each of the 202 SFs. (G) Fold change in median methylation (beta values) of the 2 SFs that consistently increase across all tumor types, with each point representing 1 tissue. Error bars represent SD. Data underlying Fig 2A and 2B can be found in S1 Data figures. Data underlying Fig 2C–2E can be found in S1 Data. Data underlying Fig 2F and 2G can be found in S2 Data. SF, splicing factor; SRRM4, Serine/Arginine Repetitive Matrix 4; TCGA, The Cancer Genome Atlas.

