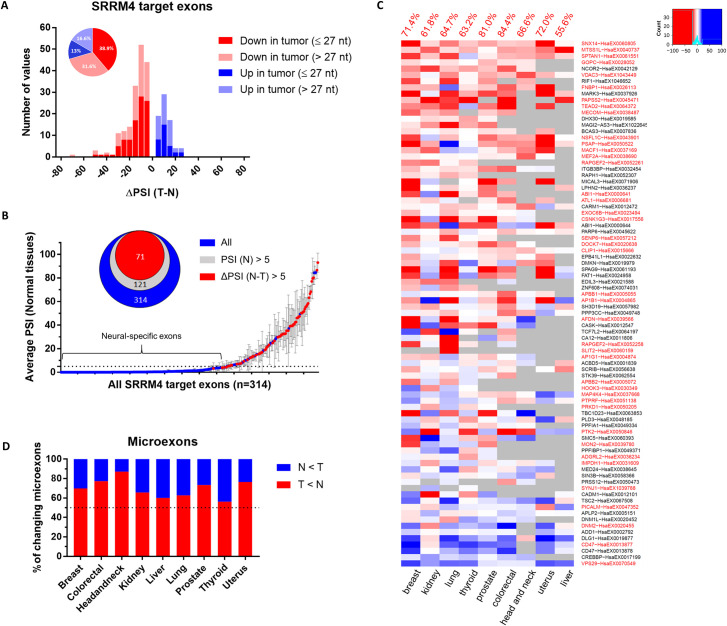
Fig 3. Inclusion of SRRM4-regulated exons is decreased in tumors and cancer cell lines.
(A) Distribution of ΔPSIs of differentially spliced SRRM4 target exons between normal and tumor samples in the TCGA datasets. Only exons with significant changes (q < 0.01, |ΔPSI| ≥ 5) are shown. Microexons (≤27 nt) and non-microexons (>27 nt) are represented in different color shades as shown in the legend. (B) SRRM4 target exons with respect to their average PSI in normal tissues. Red points are exons with PSI decreasing by at least 5% in at least 1 tumor type. Error bars represent SD of all tissues with quantifiable inclusion levels for each exon. (C) Heatmap of SRRM4 target exons ΔPSIs (Tumor − Normal) across tissue types (red = lower in tumor, blue = higher in tumor). Microexons (≤27 nt) are highlighted in red along the y-axis. The percentage of SRRM4 target exons decreasing in each tumor type is indicated in red on the top. Gray boxes indicate exons without sufficient read coverage for quantification in at least 20 tumor and normal samples. (D) The proportion of differentially regulated microexons (≤27 nt) decreasing (red) vs. increasing (blue) in tumors from each tissue type. Only microexons with significant changes (q < 0.01, |ΔPSI| ≥ 5) are shown. Data underlying Fig 3A can be found in S3 and S4 Data. Data underlying Fig 3B and 3C can be found in S1 Data figures. Data underlying Fig 3D can be found in S3 Data. nt, nucleotide; PSI, percent spliced in; SRRM4, Serine/Arginine Repetitive Matrix 4; TCGA, The Cancer Genome Atlas.

