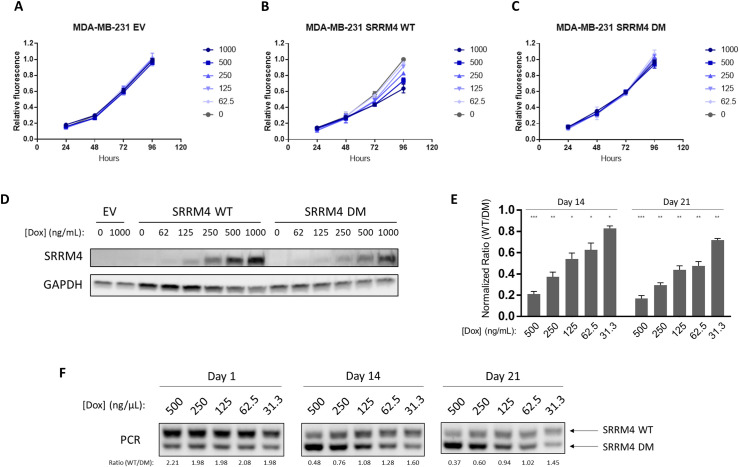
Fig 5. SRRM4 expression inhibits cancer cell proliferation.
Growth curves of MDA-MB-231 transduced with (A) EV, (B) WT SRRM4, or (C) DM SRRM4, treated with indicated concentrations of doxycycline (ng/mL). Error bars represent SEM of 2–3 independent experiments. (D) Western blot of SRRM4 expression in the same cell lines after 24 h induction with doxycycline at the indicated concentrations. Results are representative of 2 independent experiments. (E) Ratios of WT/DM SRRM4 in MDA-MB-231 cocultures show a dose- and time-dependent decrease (normalized to Day 1) that is significant at every doxycycline concentration tested (unpaired t test using Holm–Sidak method to correct for multiple comparisons; * p < 0.05, ** p < 0.01, *** p < 0.001). Results shown represent the mean of 3 independent experiments, and error bars represent standard deviation. (F) Representative PCR showing the decreased WT/DM ratios of MDA-MB-231 cocultures over time. WT/DM ratios quantified by densitometry are shown below each sample. The apparent WT/DM ratio at Day 1 is approximately 2:1, due to the formation of a chimeric PCR product of intermediate size close to the WT band. However, the ratios quantified at Day 14 and Day 21 decrease with respect to Day 1 in both a dose- and time-dependent manner, indicating that the DM cells outcompete the WT. Data underlying Fig 5A–5C and 5E can be found in S1 Data figures. DM, deletion mutant; EV, empty vector; SEM, standard error of the mean; SRRM4, Serine/Arginine Repetitive Matrix 4; WT, wild-type.

