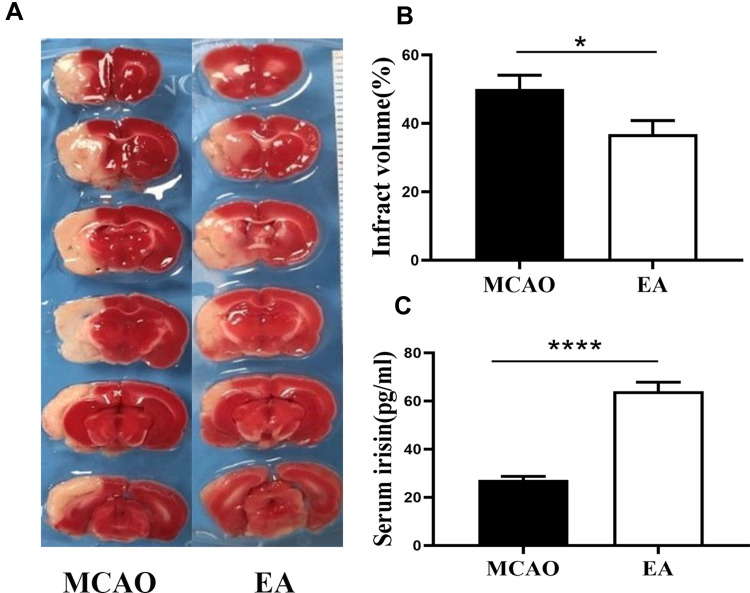
Figure 3.
The infarct volume and concentrations of irisin in serum on the 3rd day post-ischemic stroke. (A) The infarct volume was valued by TTC staining, the white color region is cerebral infraction, and the red color region is normal brain tissue. (B) The percentage of infarct volume (n =12 in MCAO group, n =13 in EA group). (C) Quantification of concentrations of irisin in serum (n =5). *p<0.05, ****p<0.0001 compared to MCAO group.

