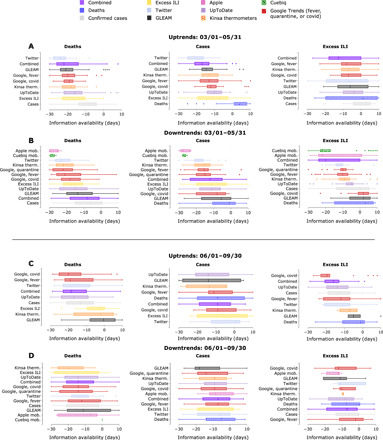
Fig. 3. Event detection results for pairwise comparisons between COVID-19 proxies and gold standards for U.S. states with available data across two time periods.

(A) and (B) illustrate the timing of proxy-specific uptrends and downtrends, respectively, relative to deaths, confirmed cases, and excess ILI from 1 March 1 to 31 May 2020. (C) and (D) similarly use box plots to illustrate the lag of COVID-19 gold standards relative to COVID-19 proxies from 1 June to 30 September 2020. Multiple events can be detected per state per time period. Proxy data were unavailable for certain states, which reflects their absence in the plots. Box plots show the median (central vertical lines), interquartile range (vertical lines flanking the median), extrema (whiskers), and outliers (dots); differences between input variable (y axis) and response variable (title) exceeding 30 days are omitted. Negative differences indicate that the input variable event activation preceded the response variable event activation. Deaths, confirmed cases, and excess ILI, as well as a combined measure, are included to intercompare gold standards. Box plots are sorted according to median value and shifted to offset delays in real-time availability.
