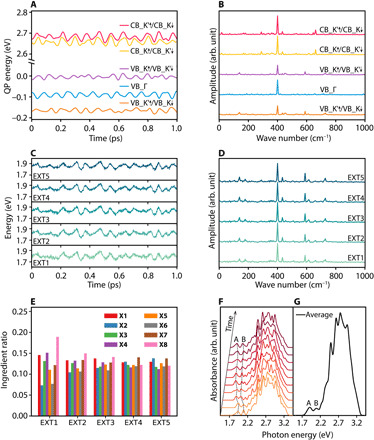
Fig. 3. Time-dependent QP and exciton energies.

(A and B) Time evolutions of the QP energies close to CBM/VBM and their Fourier transforms (FTs). (C and D) Time-dependent energies of the lowest five exciton states (EXT1 to EXT5) and their FTs. (E) The averaged ingredients over the MD trajectory for the lowest five exciton states contributed by X1-X8 configurations shown in Fig. 5. (F) Snapshots of absorption spectrum along the MD trajectory from t = 0 to t = 200 fs. The spectrum is plotted in every 20 fs. (G) Averaged absorption spectrum along the MD trajectory. The peaks for (A) and (B) excitons are marked.
