
Fig. 5. Hot spots of deforestation and degradation.
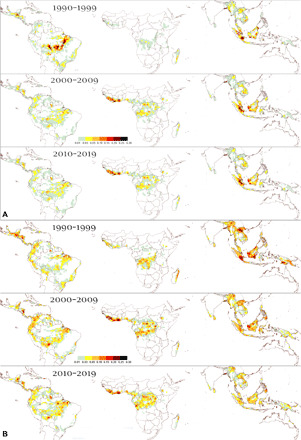
Evolution of total deforested (A) and degraded (B) areas (per box of 1° latitude by 1° longitude size; scale in million hectares) within the labeled time intervals (1990–1999, 2000–2009, and 2010–2019).