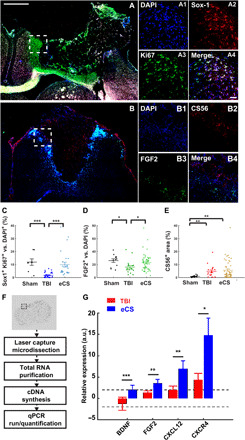
Fig. 2. eCS implants promote NSC proliferation and neurotrophic factor expression 20 weeks after sTBI.

(A) Representative tiled images of ipsilesional hemisphere (left coronal sections) of eCS rat brain tissue; scale bar, 1 mm. (A1 to A4) Representative magnification of dashed white square shown in (C) for DAPI (A1), Sox-1 (A2), Ki67(A3), and merged (A4); scale bar, 100 μm. (B) Representative tiled images of ipsilesional hemisphere (left coronal sections) of eCS rat brain tissue; scale bar, 1 mm. (B1 to B4) Representative magnification of dashed white square shown in (A) for DAPI (B1), CS56 (B2), FGF2 (B3), and merged (B4); scale bar, 100 μm. (C) Colocalization of Sox-1+ cells with Ki67+ cells as a percentage of Ki67+ cells for each treatment. Kruskal-Wallis, treatment: P < 0.001. (D) Colocalization of FGF2+ cells with DAPI+ cells as a percentage of DAPI+ cells for each treatment. Kruskal-Wallis, treatment: P < 0.05. (E) CS56+ percentage area for each treatment. Kruskal-Wallis, treatment: P < 0.001. Post hoc LSD Mann-Whitney U test, *P < 0.05, **P < 0.01, and ***P < 0.001. (F) At 20-week time point, brains were flash-frozen and tissue was laser capture microdissected. Total RNA was purified and used to synthesize cDNA. Quantitative reverse transcription polymerase chain reaction (qRT-PCR) was performed using prevalidated primers of interest for quantification of gene expression. (G) Relative expression of BDNF, FGF2, CXCL12, and CXCR4 transcripts in TBI and eCS treatment groups. Two-tailed t test, *P < 0.05, **P < 0.01, and ***P < 0.001. Graphs show means ± SEM.
