
Fig. 3. eCS implants promote neurogenesis and plasticity 20 weeks after sTBI.
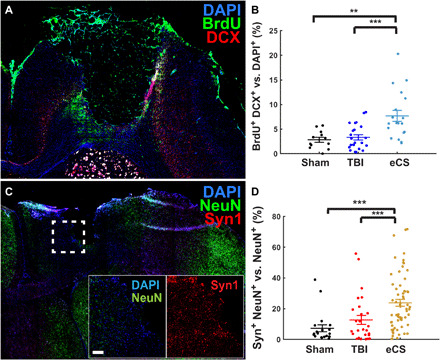
(A) Representative tiled images of ipsilesional hemisphere (left coronal sections) coronal sections with merged DAPI (blue), DCX (red), and BrdU (green) staining of eCS rat brain tissue; scale bar, 1 mm. (B) Colocalization of DCX+ and BrdU+ cells with DAPI+ cells as a percentage of DAPI+ cells for each treatment; Kruskal-Wallis, treatment: P < 0.001. (C) Representative tiled images of ipsilesional hemisphere (left coronal sections) with merged DAPI (blue), Syn1 (red), and NeuN (green) staining of eCS rat brain tissue; scale bar, 1 mm. Inset shows magnified images of DAPI+ and NeuN+ cells (merged; left) and Syn1+ cells (right) from the region represented by the dashed white square; scale bar, 100 μm. (D) Colocalization of Syn+ cells with NeuN+ cells as percentage of NeuN+ cells for each treatment. Kruskal-Wallis, treatment: P < 0.001. Post hoc LSD Mann-Whitney U test, *P < 0.05, **P < 0.01, and ***P < 0.001. Graphs show means ± SEM.