
Fig. 6. eCS matrix implants promote changes in intra- and perilesional vascular architecture 8 weeks after sTBI.
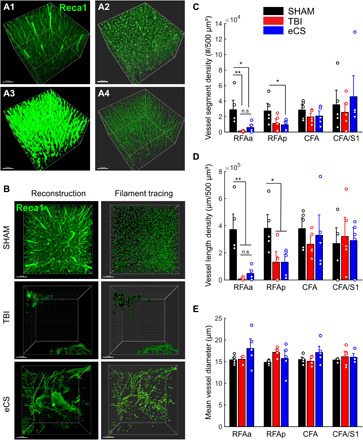
(A) Image processing step for vasculature tracing. Using Imaris software on volumetric images of iDisco+ cleared brains, we first reconstructed volumetric images from Reca1+ staining (green, A1) and performed surface mapping (A2), surface-based masking and Gaussian filtering (A3), and finally filament tracing (A4). Representative vascularization in eCS implanted region; original Reca1+ images (left) and ROIs corresponding to vasculature tracing (right). (B) Representative images of Sham (top), TBI (middle), and eCS (bottom) rat brain tissue for the reconstructed original volume image (left) and vasculature tracing (right). (C) Quantification of blood vessel segment density per 500 μm3 for Sham (n = 15), TBI (n = 15), and eCS (n = 15) groups in all four ROIs. (D) Quantification of blood vessel length density per micrometer/500 μm3 for Sham (n = 15), TBI (n = 15), and eCS (n = 15) groups in all four ROIs. (E) Quantification of mean blood vessel diameter (volume: 500 μm3) for Sham (n = 15), TBI (n = 15), and eCS (n = 15) groups in all four ROIs. Post hoc LSD Mann-Whitney U test, *P < 0.05, **P < 0.01, and ***P < 0.001. Bar graphs show means ± SEM. RFAa, RFA anterior; RFAp, RFA posterior/perilesional. Graphs show means ± SEM.