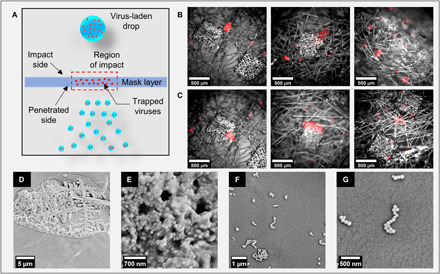
Fig. 7. Viral load trapping on a mask.

(A) Schematic diagram of viral load getting trapped inside the mask layer. The droplets and virus are not drawn to scale. (B) Overlaid bright-field and fluorescence microscopy images showing trapped particles on the impact side for a single, double, and triple layer of mask A (left to right in order). (C) Overlaid bright-field and fluorescence microscopic images show trapped particles on the penetration side for a single, double, and triple layer of mask A (left to right in order). Similar results are obtained for mask B (see fig. S10). (D) SEM image of particle lump accumulated on the mask surface and corresponding zoomed-in image (E) showing coagulation of particles as a lump. (F) SEM image of discrete particles on mask surface and corresponding zoomed-in view (G) of deposition. Scale bar description is included in the figures.
